History View
The History view gives a more comprehensive perspective on a monitor’s data, letting you visualize bandwidth activity or connection quality for periods extending from the last few hours to years in the past.
Both Bandwidth Monitors and Latency Monitors have a History view:
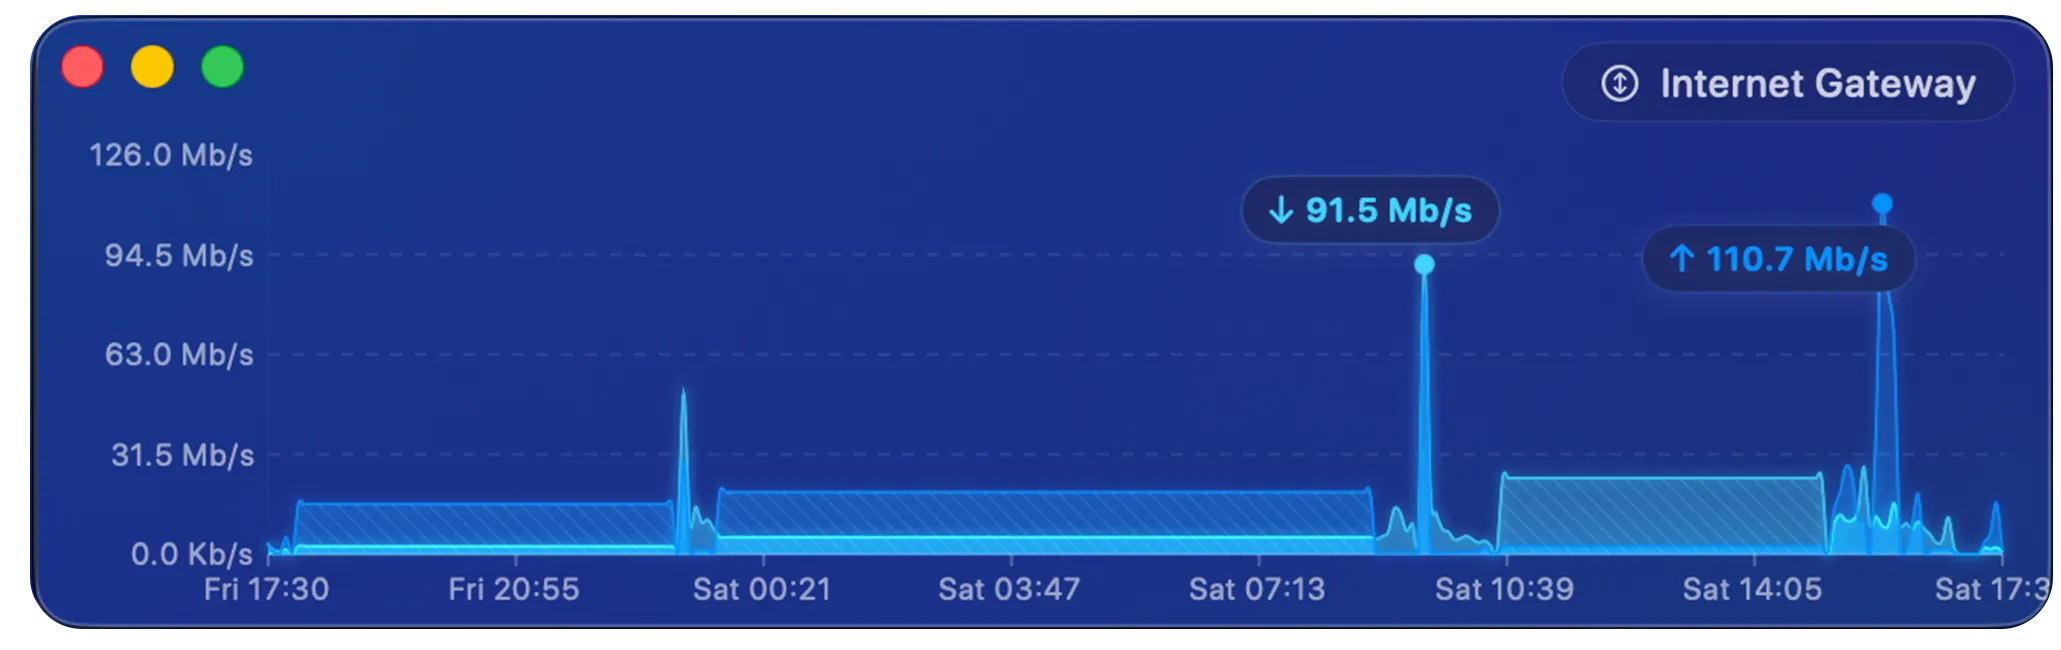
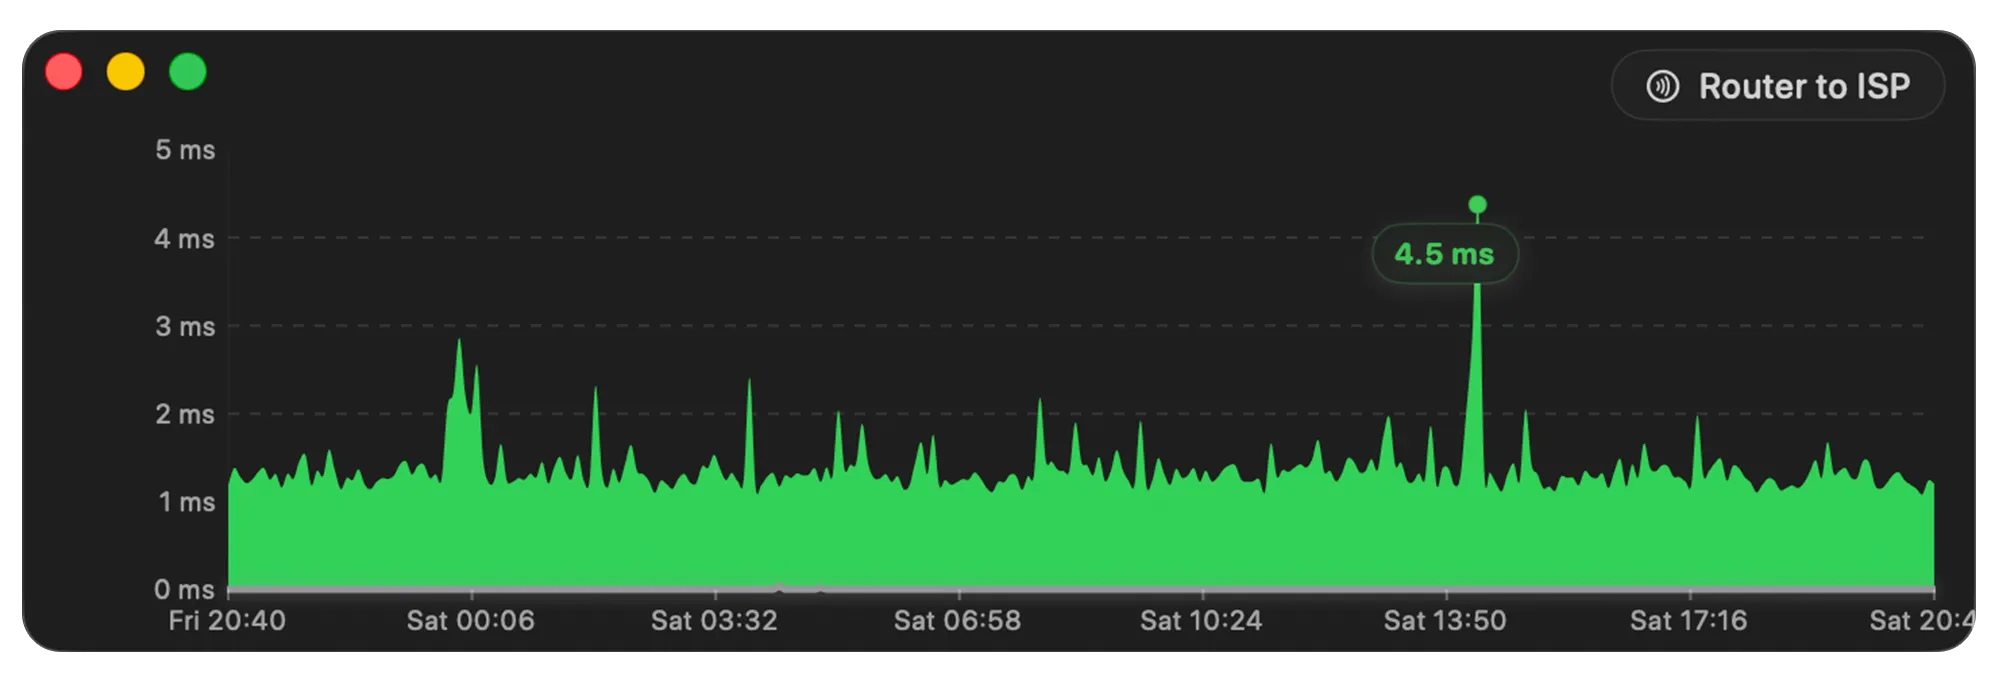
Opening the History view
Section titled “Opening the History view”There are two ways to open the History view for a monitor:
- Click the History button (
 ) in the graph toolbar above the monitor’s graph.
 - If the graph isn’t visible, right-click the monitor and choose History… from the menu.
You can also click the Open History button in the Bandwidth Monitors or Latency Monitors section header to get a menu of that section’s monitors — choose one to open its History view. Once the window is open, use its sidebar to switch between monitors without reopening it.
Reading the graph
Section titled “Reading the graph”Hover over any point on the graph to see the actual value at that moment. To inspect a span of time, drag-select a range — PeakHour shows the total (for usage) or the average (for speed) across the selected period.
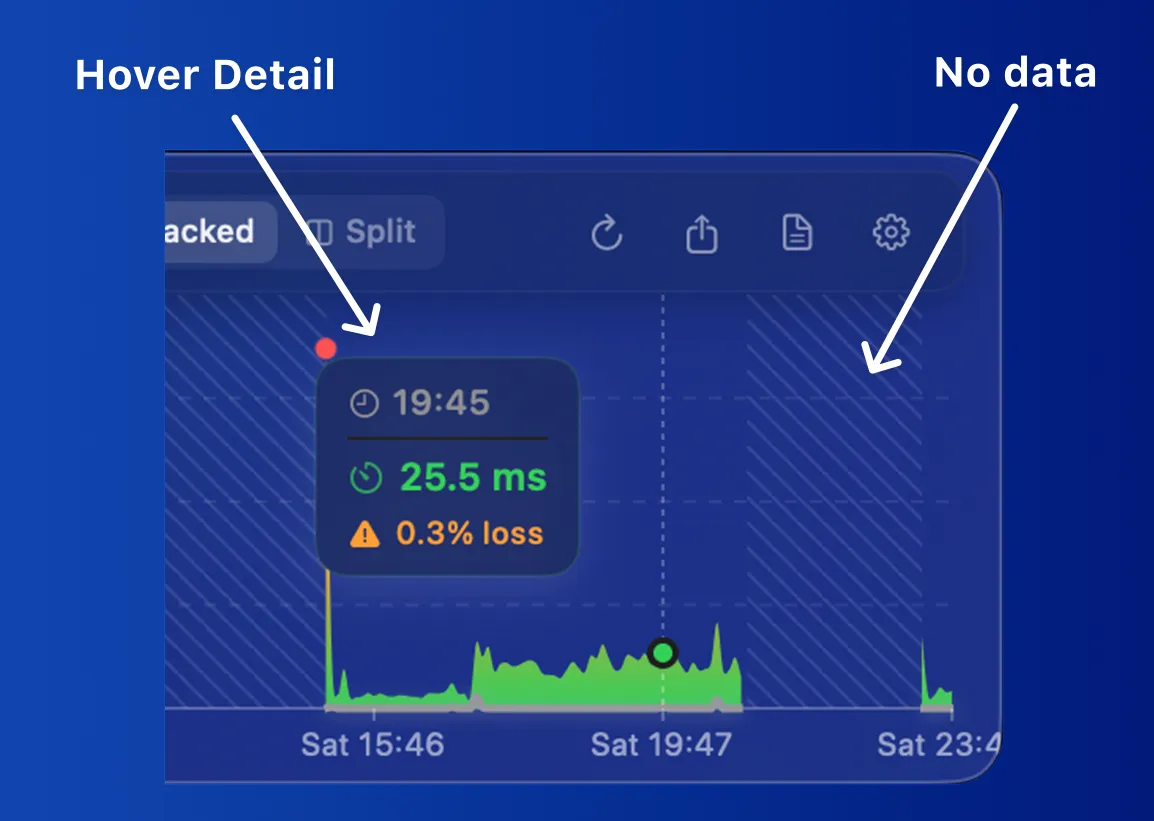
- Hover detail — a tooltip showing the values at the point under the pointer. For a latency monitor this is the time, latency, and packet loss; for a bandwidth monitor it’s the time and the usage or speed.
- No data — a hatched region marks periods where no data was recorded, for example while PeakHour wasn’t running. For latency monitors, see Outages and downtime for how PeakHour tells these gaps apart from a genuine outage.
- Estimated — for bandwidth monitors, an Estimated tag indicates usage that PeakHour calculated by averaging the total data used between the time it stopped running and the time it started again, rather than measuring it directly.
Outages and downtime
Section titled “Outages and downtime”When there’s a gap in a latency monitor’s history, PeakHour tries to tell the difference between a real outage — your connection was actually down — and simply not monitoring, such as when your Mac was asleep, the app was closed, or monitoring was paused. It only counts time as downtime when it has evidence the connection genuinely failed.
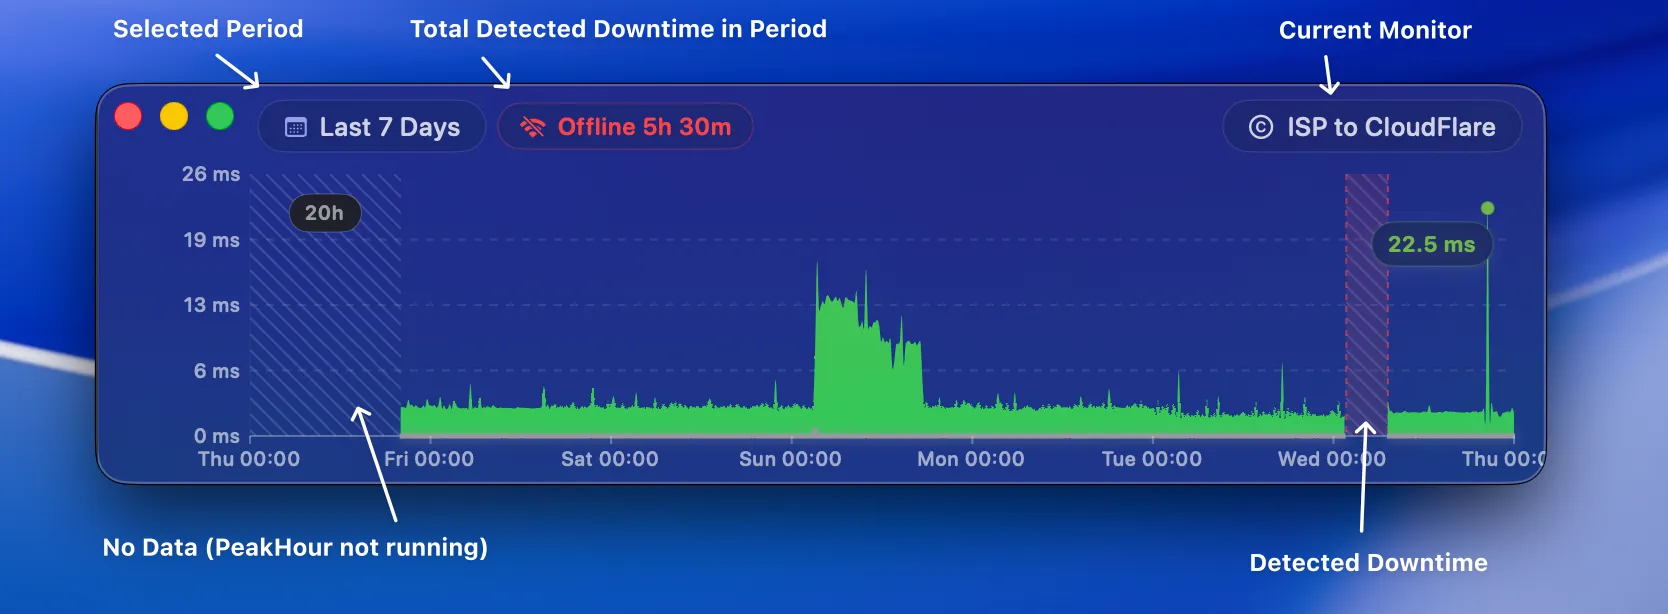
- Offline — a red band marks time PeakHour is confident the connection was down. The Offline 5h 30m total at the top of the window adds up every detected outage across the period you’re viewing.
- No data — a hatched band marks a gap where PeakHour can’t prove there was an outage, most often because your Mac was asleep or PeakHour wasn’t running. Rather than overstate things, PeakHour shows these as No data instead of downtime.
- Hover any band to see how long it lasted.
PeakHour counts a silent gap as a genuine outage when either of these is true:
- The connection was visibly failing — the checks taken just before or after the gap were almost entirely failing, with near-total packet loss as the link dropped and then went silent.
- Your Mac was clearly still online — another monitored target kept reporting normally during the same gap. If one target goes silent while others are still being checked, your Mac was awake and connected, so that target was genuinely unreachable.
If neither is true, the gap is shown as No data rather than downtime. A gap also has to last at least a couple of monitoring intervals before it’s labelled, so momentary blips don’t clutter the graph.
The toolbar
Section titled “The toolbar”The toolbar along the top of the window controls the period being shown, the level of detail, and how the data is displayed.
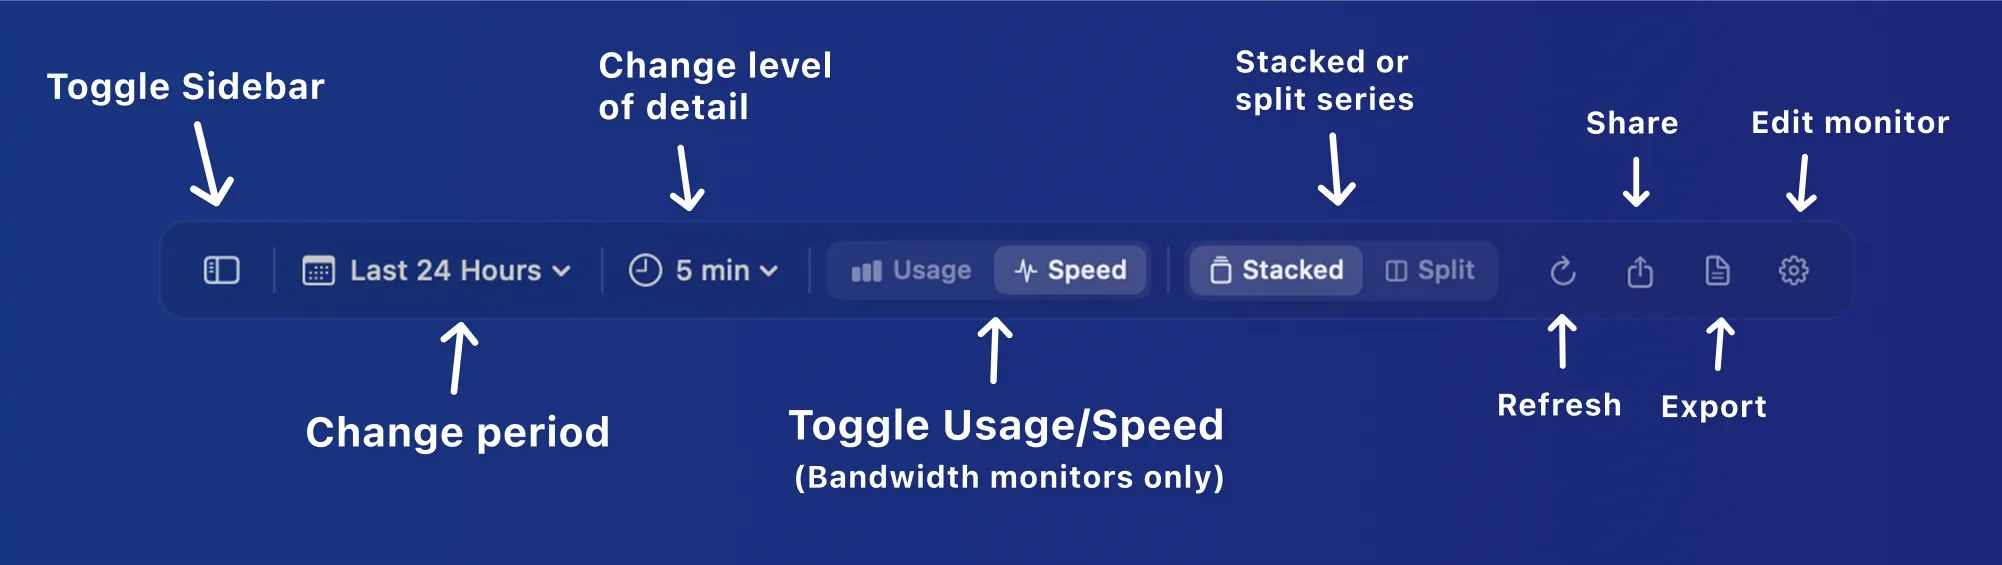
From left to right:
| Control | Description |
|---|---|
| Show / Hide Sidebar | Shows or hides the sidebar, which lists the monitors available to view in the History window. |
| Graph period | Sets the time range to display. Choose one of the presets, or select Choose Dates… to pick a custom start and end date. |
| Level of detail | Sets how much time each point on the graph represents — for example, 5-minute intervals for 12 hours of data, or one-day intervals for several months. Higher detail over long periods can take a few seconds to calculate. |
| Usage / Speed | Toggles between the total amount of data used (Usage) and the average speed for each point (Speed). Bandwidth monitors only. |
| Stacked / Split | Shows inbound and outbound on the same axis (Stacked) or on separate axes (Split). |
| Refresh | Forces the graph to refresh. |
| Share | Shares a picture of the graph via Mail, Messages, AirDrop, etc. |
| Export | Exports the data currently shown to a CSV file. |
| Edit monitor | Opens settings for the monitor being shown. |
The latency History view has the same toolbar without the Usage / Speed toggle, since latency monitors only show a single measurement type.
Was this page helpful?
Found something wrong, unclear, or out of date? Let us know and we'll fix it.