Configuration Assistant: Bandwidth Monitor
A Bandwidth Monitor measures the upload and download throughput of a device on your network. The Configuration Assistant walks you through adding one step by step.
PeakHour can measure bandwidth in three ways:
- UPnP (Universal Plug and Play) — for routers that report throughput over UPnP. These devices are discovered automatically.
- SNMP (Simple Network Management Protocol) — for routers, switches, and other devices that support SNMP. PeakHour supports SNMPv1, v2c, and v3, with both 32-bit and 64-bit counters.
- Local Interface — an interface on your Mac itself, such as Wi-Fi or Ethernet.
1. Choose the monitor type
Section titled “1. Choose the monitor type”The first screen asks what kind of monitor you want to add. Choose Bandwidth and click Next.
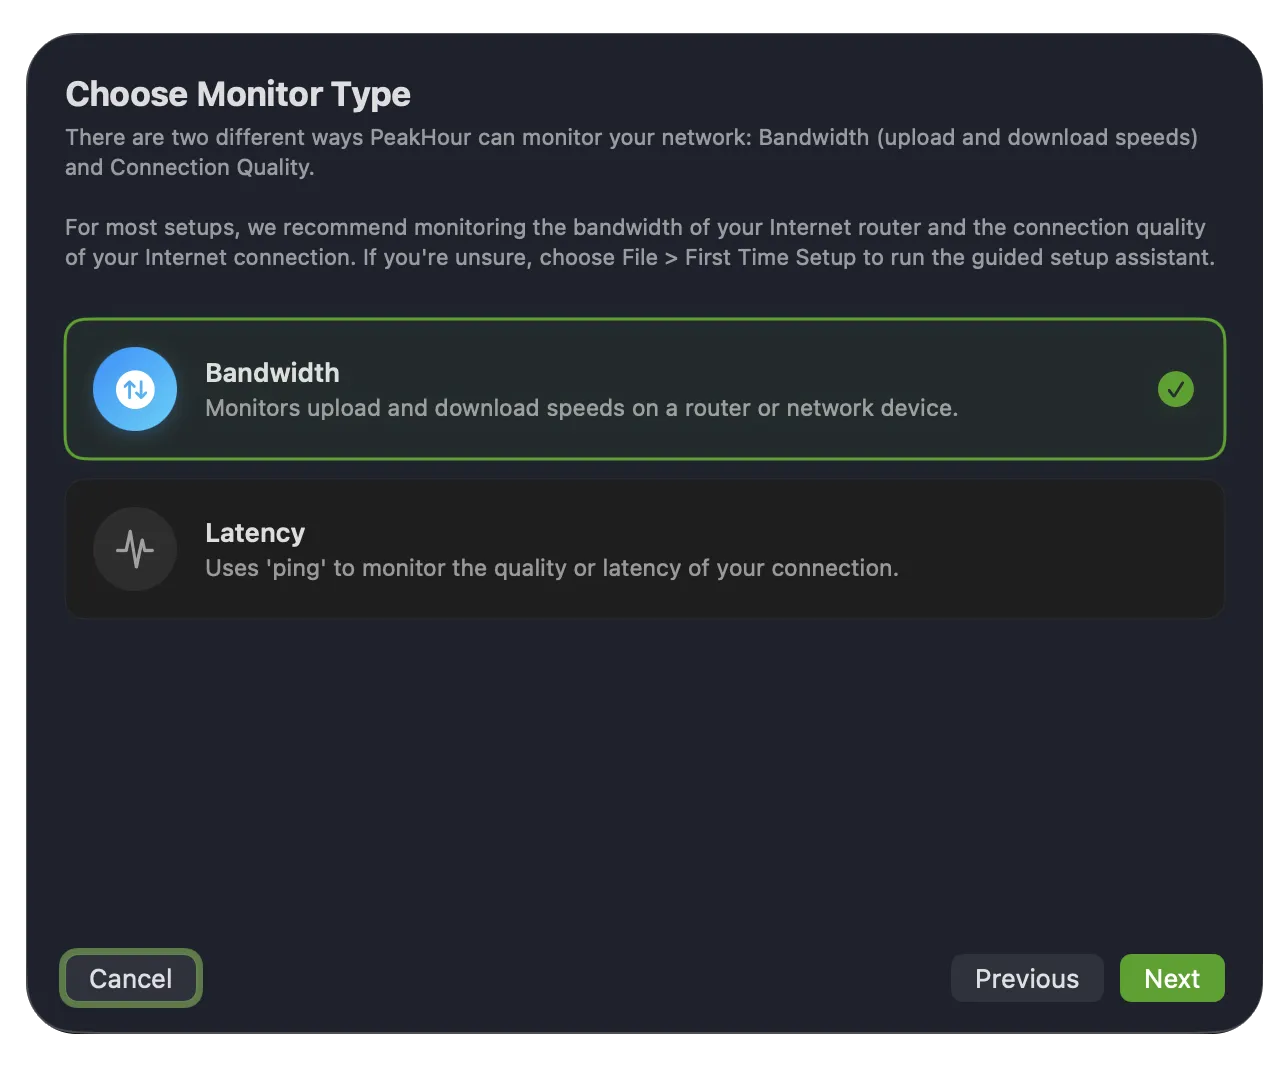
To monitor latency instead, choose Latency — see Configuration Assistant: Latency.
2. Choose a device
Section titled “2. Choose a device”PeakHour scans your network for compatible devices and lists what it finds. You have three choices:
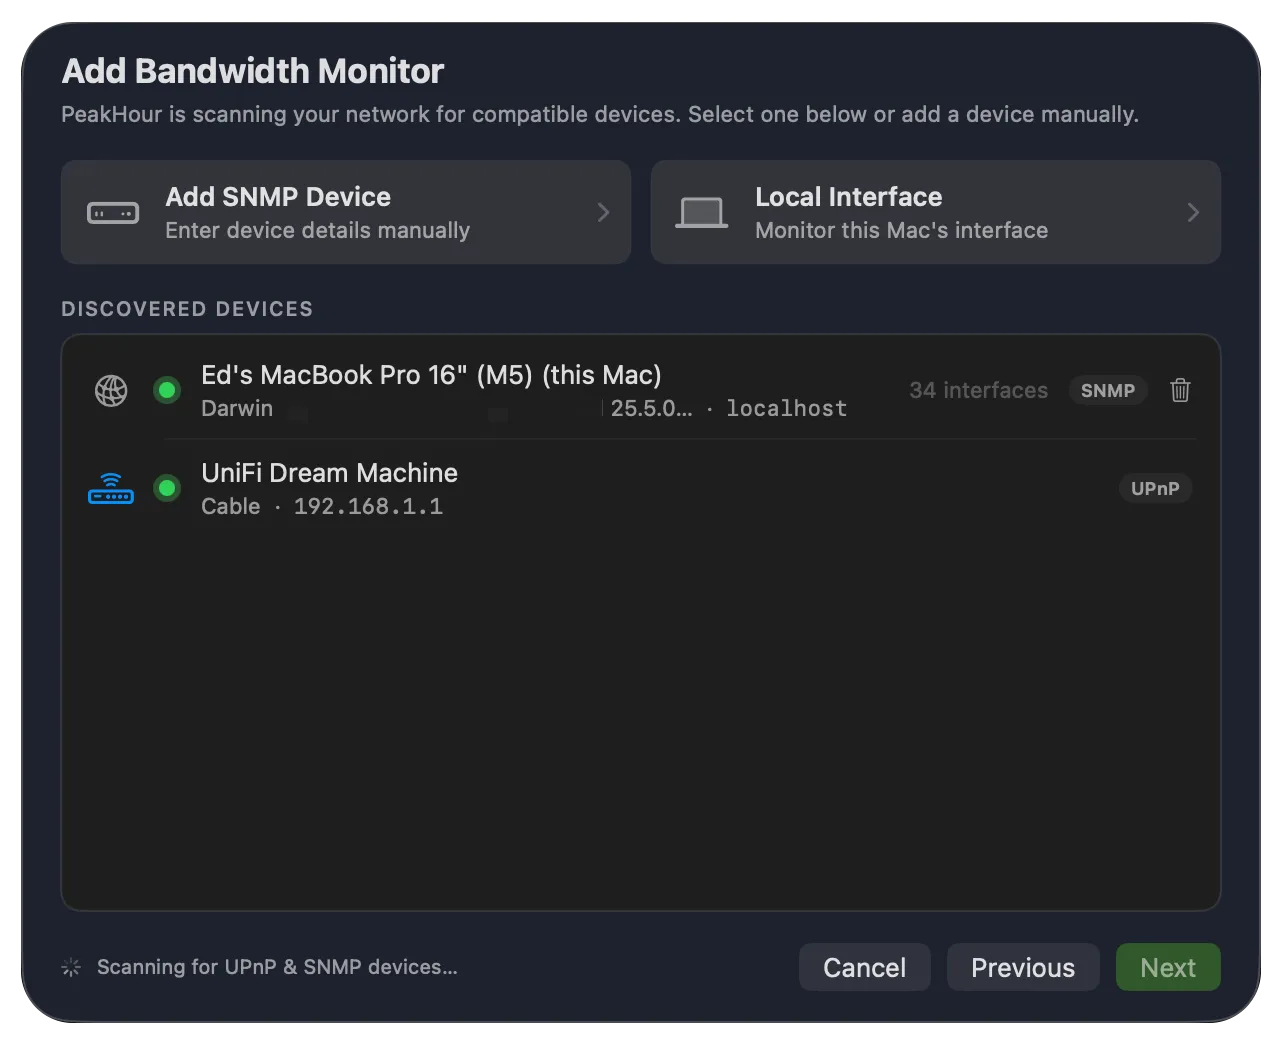
- Add SNMP Device — enter an SNMP device’s details manually. Use this when the device you want isn’t discovered automatically.
- Local Interface — monitor an interface on this Mac.
- Discovered devices — the list below the two buttons. It includes devices found via UPnP, along with other Macs running SNMP via PeakHour Enabler. Each entry shows a status dot, the device’s address, and a badge indicating how it was found (UPnP or SNMP).
Select a device or button and click Next.
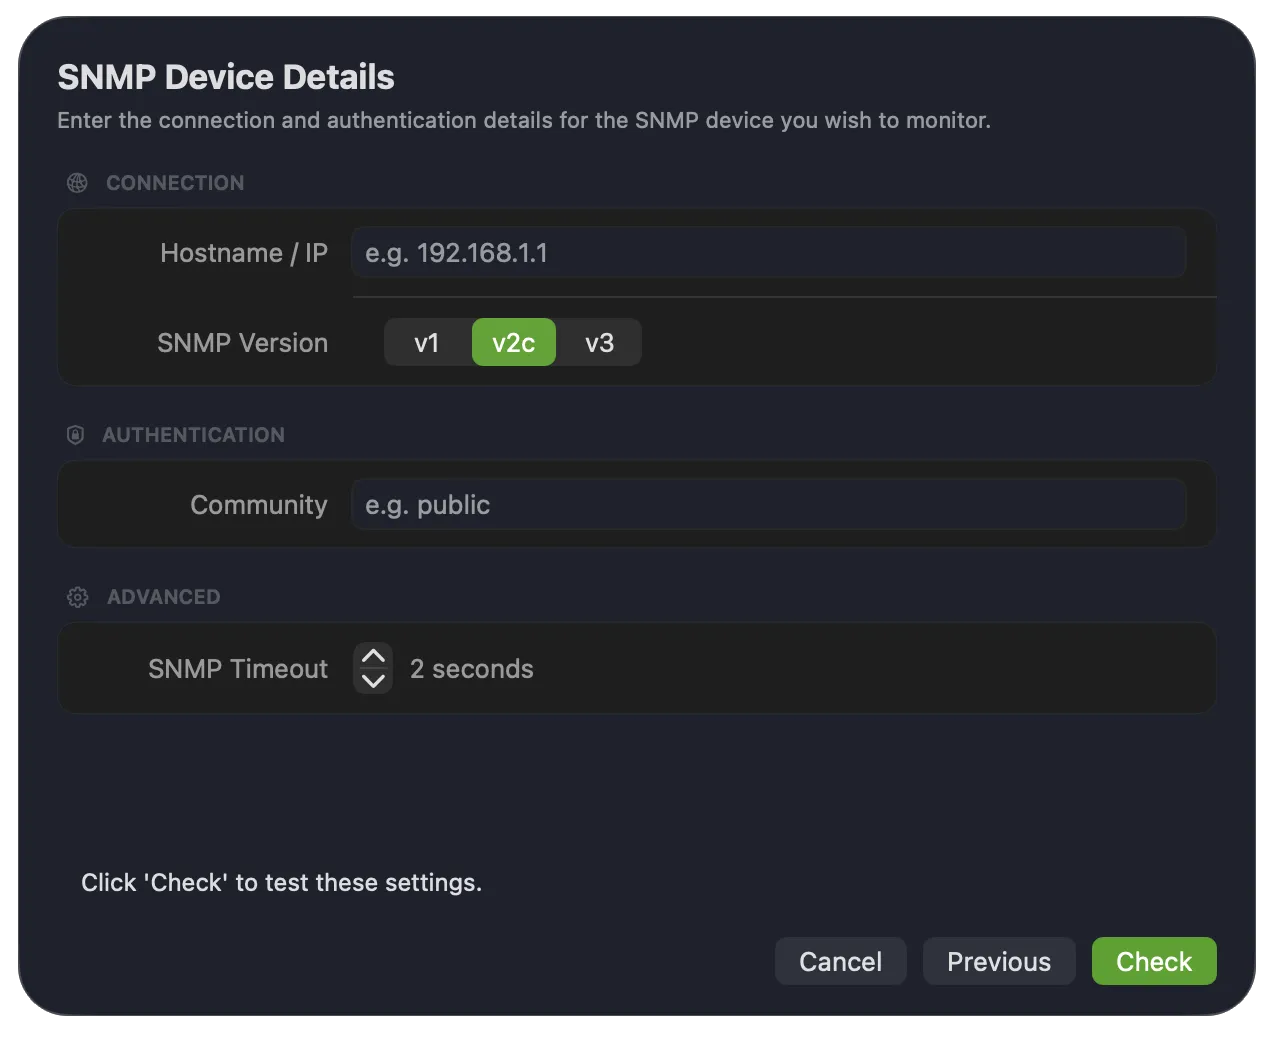
3. Enter SNMP details
Section titled “3. Enter SNMP details”If you chose Add SNMP Device, enter the device’s connection and authentication details. Before you start, make sure you have the device’s hostname or IP address and its SNMP credentials — the community string for SNMP v1/v2c, or the Security Name, Auth Key, and optional Privacy Key for SNMPv3.
| Field | Description |
|---|---|
| Hostname / IP | The hostname, FQDN, or IP address of the device you want to monitor. |
| SNMP Version | The SNMP version the device uses — v1, v2c, or v3. If you’re unsure, try v1/v2c first. |
| Community | The SNMP community string (essentially a password) the device responds to. A read-only community is sufficient. Shown for v1 and v2c. |
| SNMP Timeout | How long PeakHour waits for a response before giving up. The default of 2 seconds suits most networks. |
When you select v3, additional authentication fields replace Community:
| Field | Description |
|---|---|
| Security Name | The SNMPv3 username the device authenticates against. |
| Security Mode | The level of security to use — authentication and/or privacy (encryption). |
| Auth Key | The authentication passphrase for the security name. |
| Privacy Key | The optional passphrase used to encrypt the data. |
| Protocol | The authentication and privacy algorithms the device expects. |
SNMPv3 adds stronger authentication and encryption, but it’s newer and generally only supported by more capable devices. For background on SNMPv3 security, see snmp.com’s SNMPv3 introduction.
Click Check to test the settings.
4. Select an interface
Section titled “4. Select an interface”SNMP and local-interface devices can have several network interfaces. Choose the one you want to monitor and click Next.
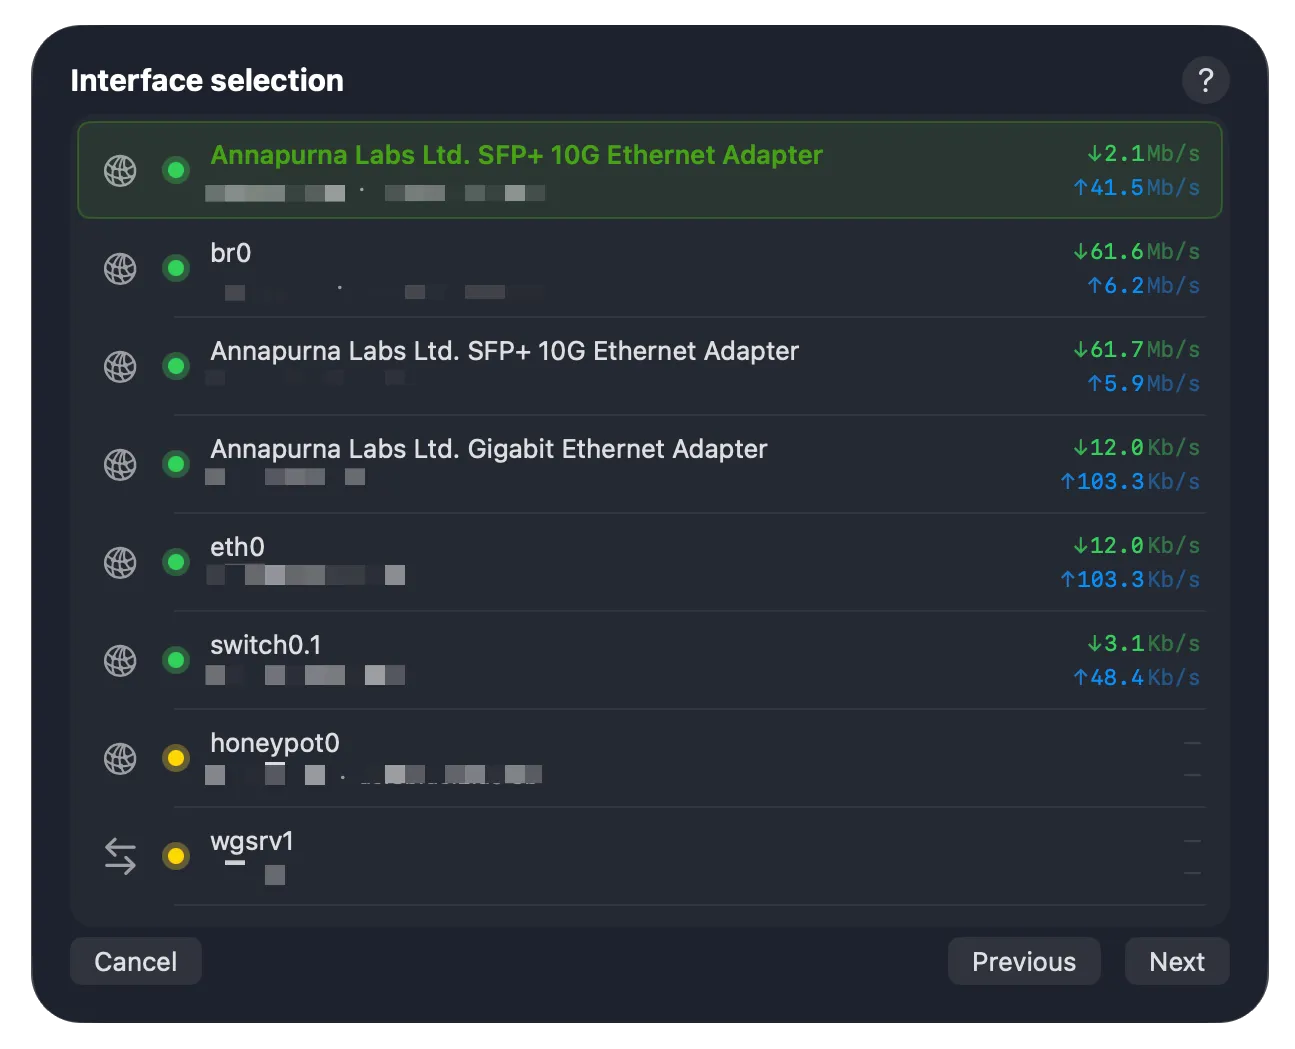
Each interface shows its current download (↓) and upload (↑) throughput, which makes it easier to spot the right one. Most of the time you’ll want the Internet (WAN) interface — on many routers this is named wan0, pppoe0, internet, or similar. Interface names vary between manufacturers and devices, so you may need to do a little detective work if you’re not sure which one to pick.
To monitor more than one interface (say, both Internet and Wi-Fi), add the device again and choose a different interface each time.
5. Verify settings
Section titled “5. Verify settings”The Verify Settings screen checks the configuration and shows a live view of throughput so you can confirm everything is working before finishing.
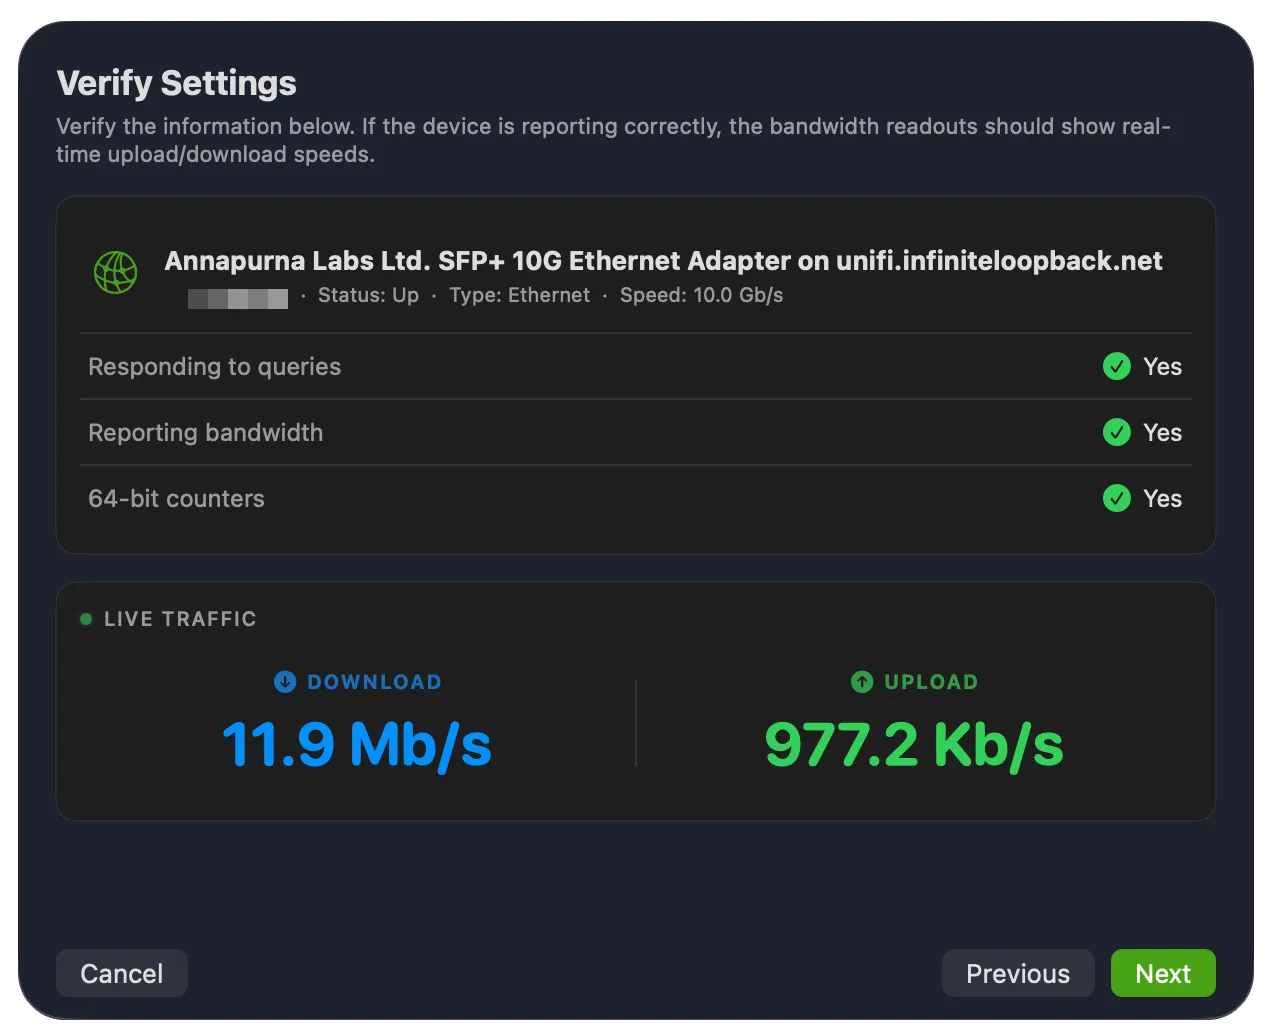
| Check | What it means |
|---|---|
| Responding to queries | Whether the device responds to SNMP or UPnP queries and returns meaningful data. |
| Reporting bandwidth | Whether the device appears to report traffic correctly. This can read Yes even if the figures don’t match your expectations, so confirm with a real test — download a file of known size or run a speed test and watch the Live Traffic readout. |
| 64-bit counters (SNMP only) | Whether the interface supports high-capacity (64-bit) counters, which are needed to measure high-speed links accurately. |
If the Live Traffic readout reflects throughput as you’d expect, click Next.
6. Finalize setup
Section titled “6. Finalize setup”The last screen sets a few key parameters. You can adjust all of these (and many more) later in Settings → Bandwidth Monitor.
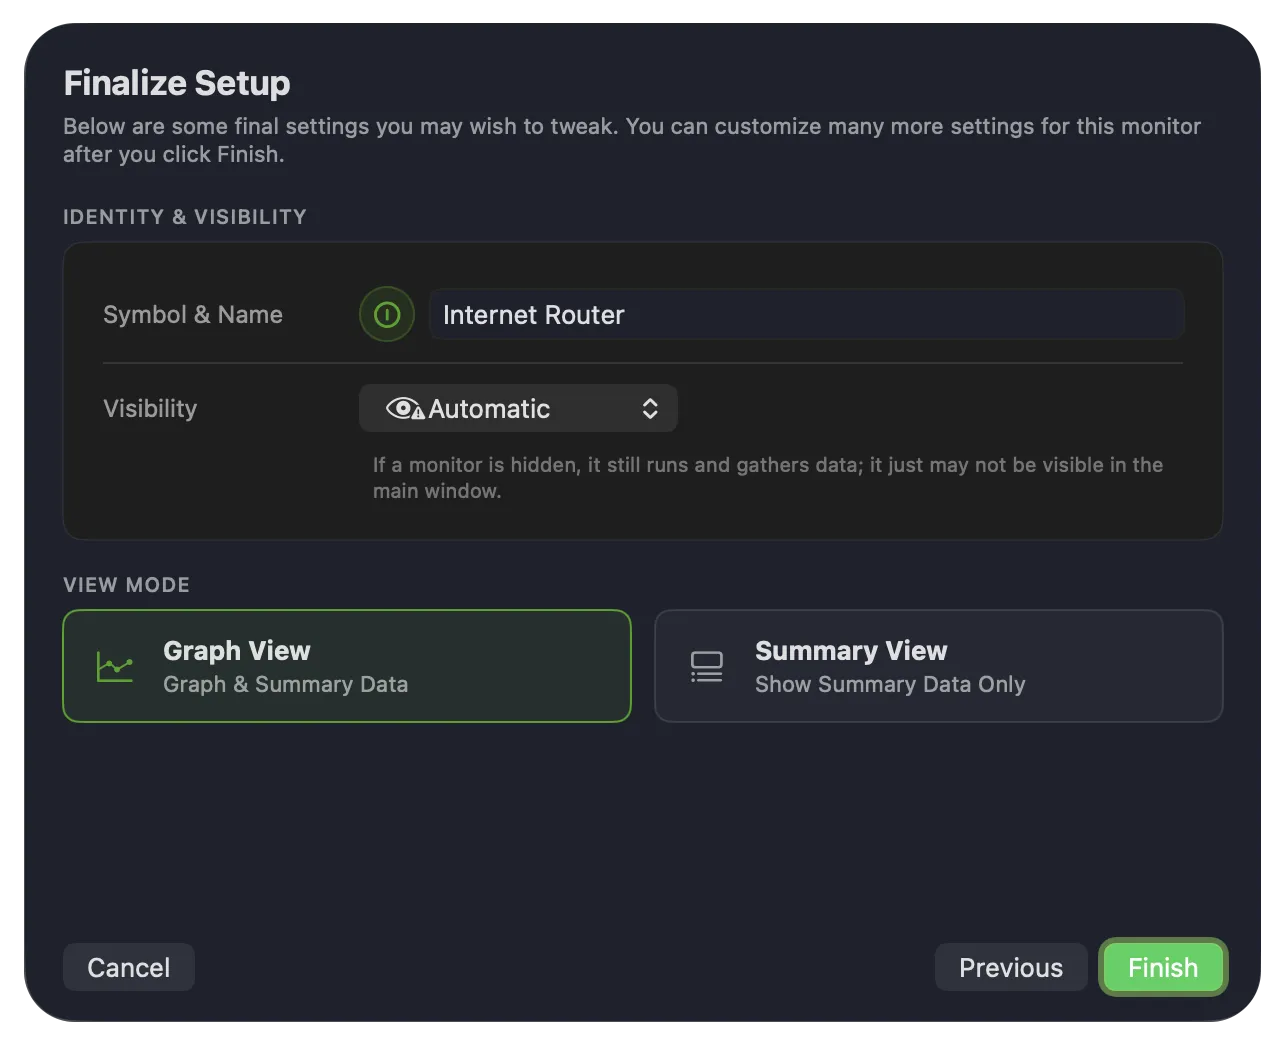
| Setting | Description |
|---|---|
| Symbol & Name | The icon and name for the monitor. Click either to change it. |
| Visibility | Whether the monitor appears in the main window. Automatic hides it when it can’t be reached; you can also force it to always show or always hide. A hidden monitor still runs and gathers data — it just may not be visible. |
| View Mode | Graph View shows the monitor with its graph; Summary View shows summary data only (collapsed). |
Click Finish. The new monitor appears in the main window and, if configured, the menu bar.
What next?
Section titled “What next?”There are many more ways to customise a Bandwidth Monitor — see the Bandwidth Monitor settings.
If PeakHour didn’t find your device, double-check that UPnP or SNMP is enabled on it, then use Add SNMP Device to add it by hostname or IP.
Was this page helpful?
Found something wrong, unclear, or out of date? Let us know and we'll fix it.