Configuration Assistant: Latency
A Latency Monitor pings a host or hop and measures the round-trip time for a reply to come back, letting you track the latency and responsiveness of a point on your network path. The Configuration Assistant walks you through adding one step by step.
1. Choose the monitor type
Section titled “1. Choose the monitor type”The first screen asks what kind of monitor to add. Choose Latency and click Next.
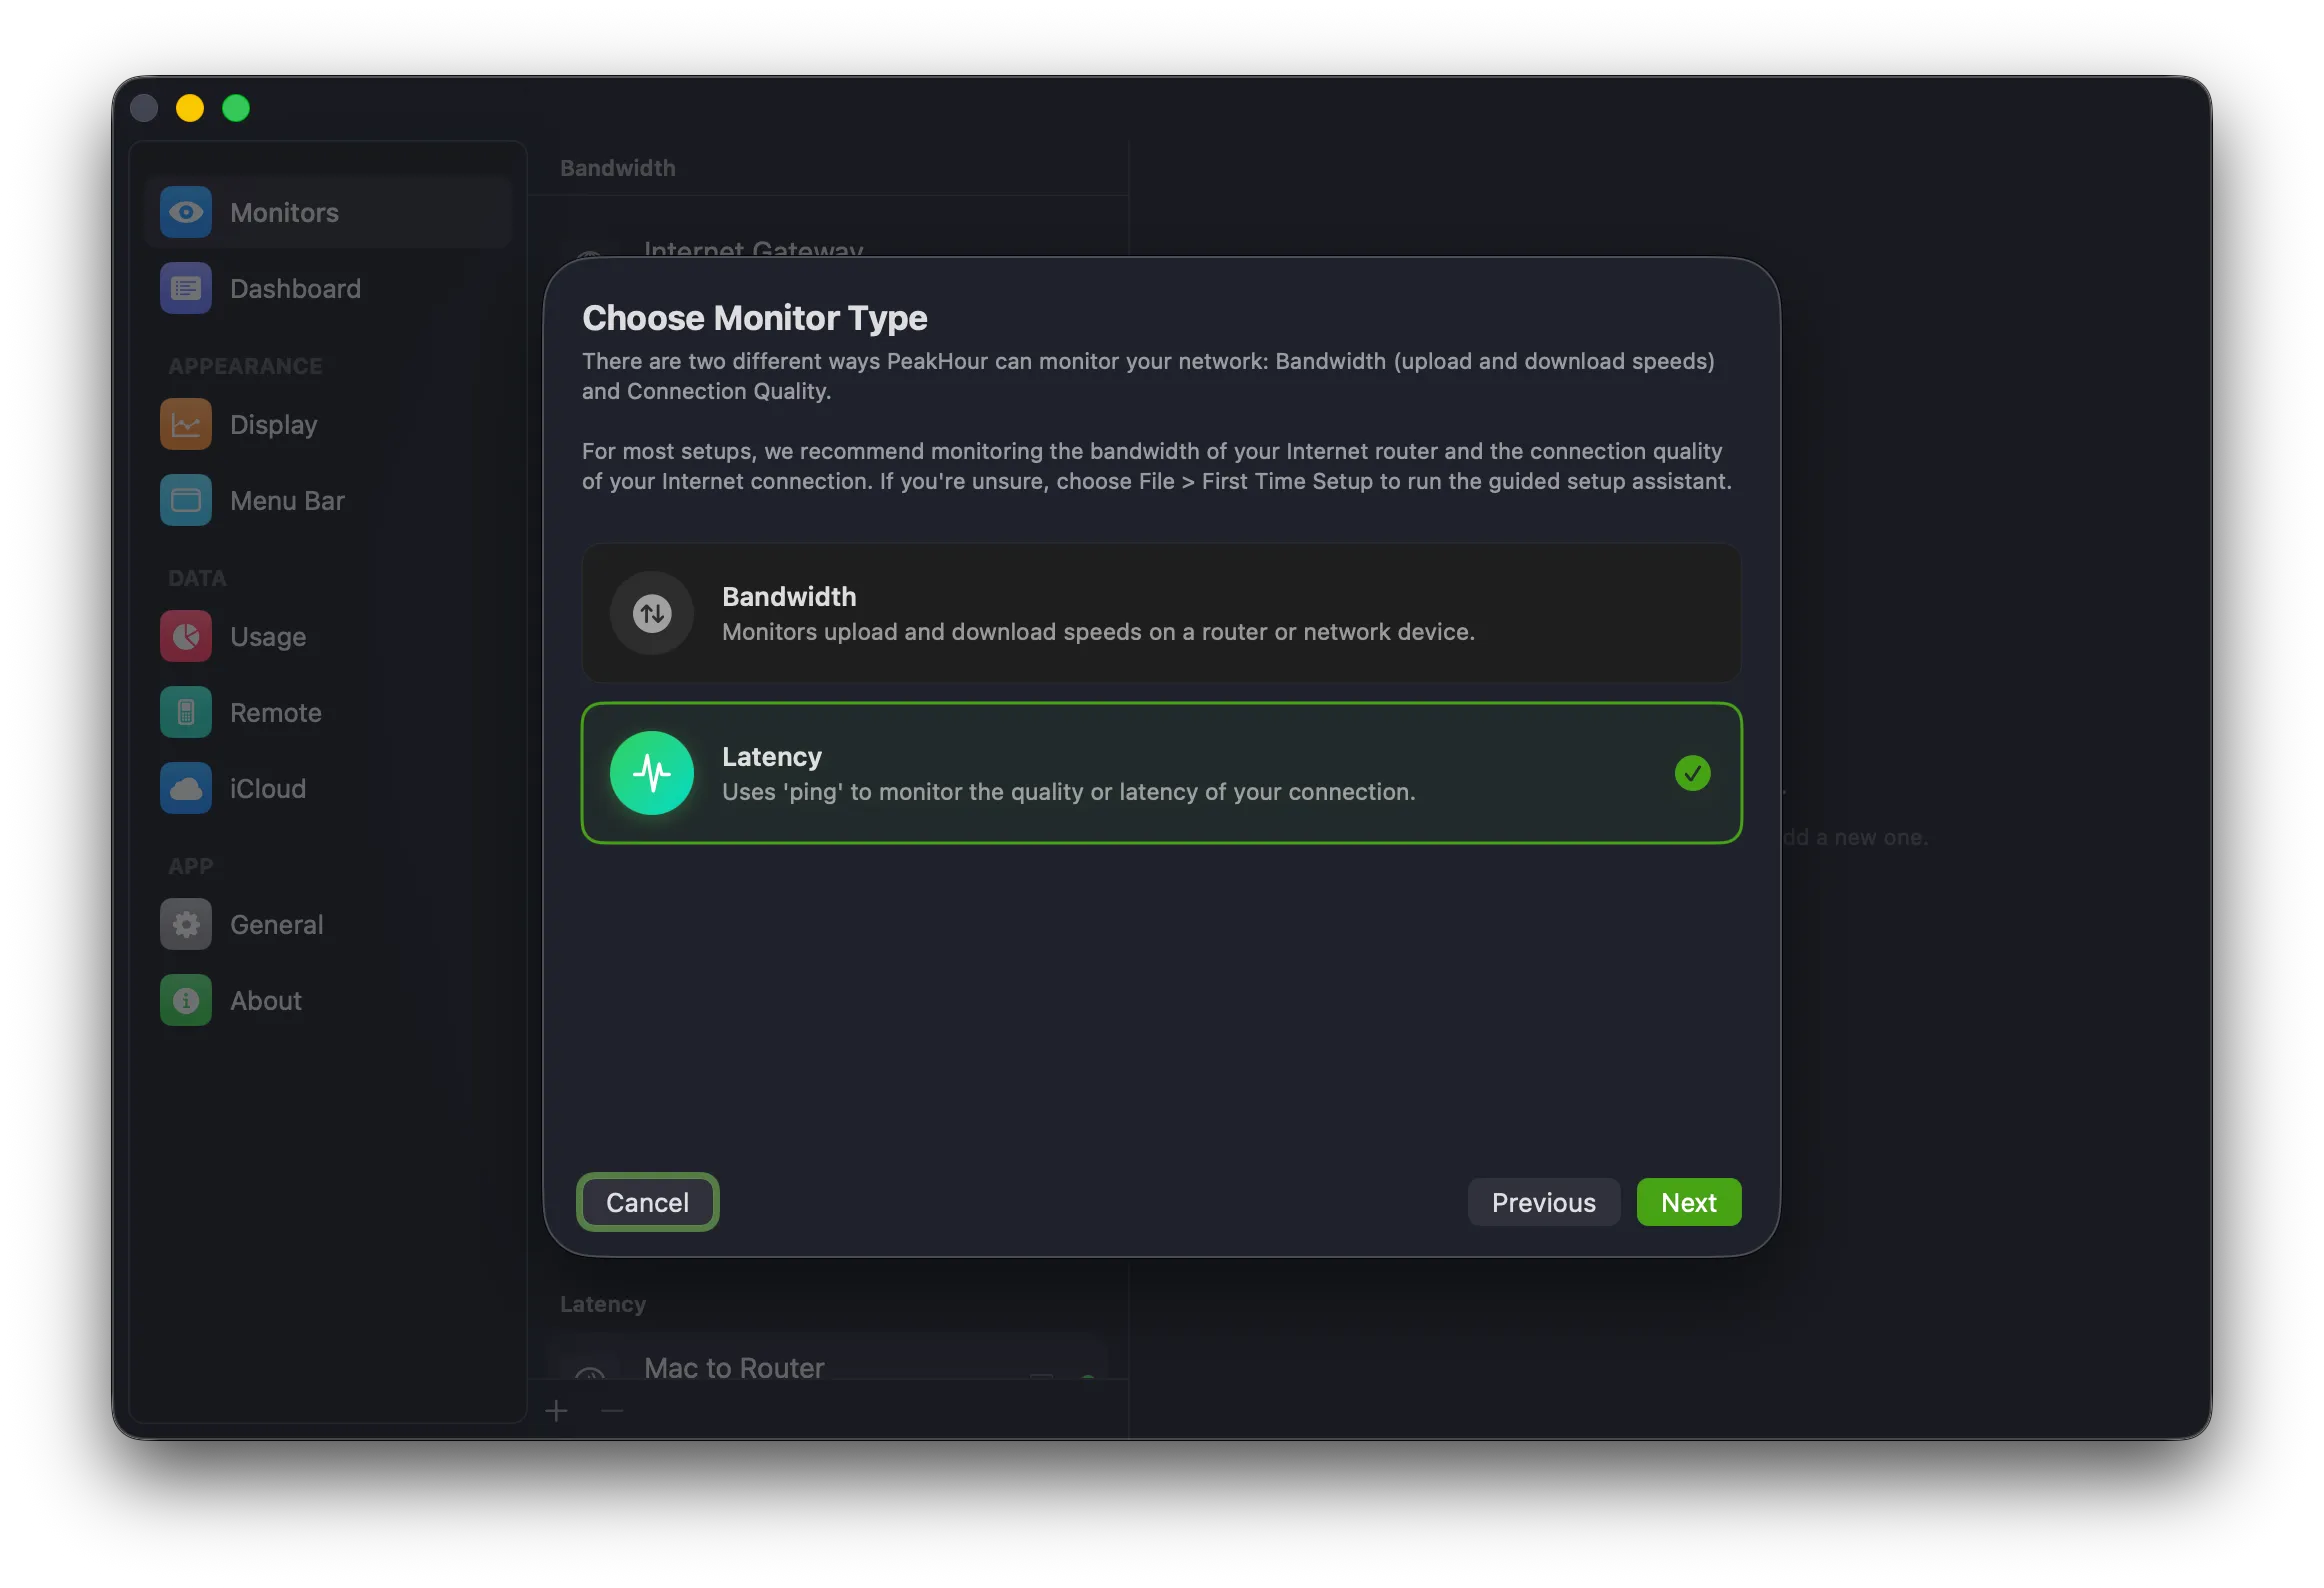
To monitor throughput instead, choose Bandwidth — see Configuration Assistant: Bandwidth Monitor.
2. Choose what to measure
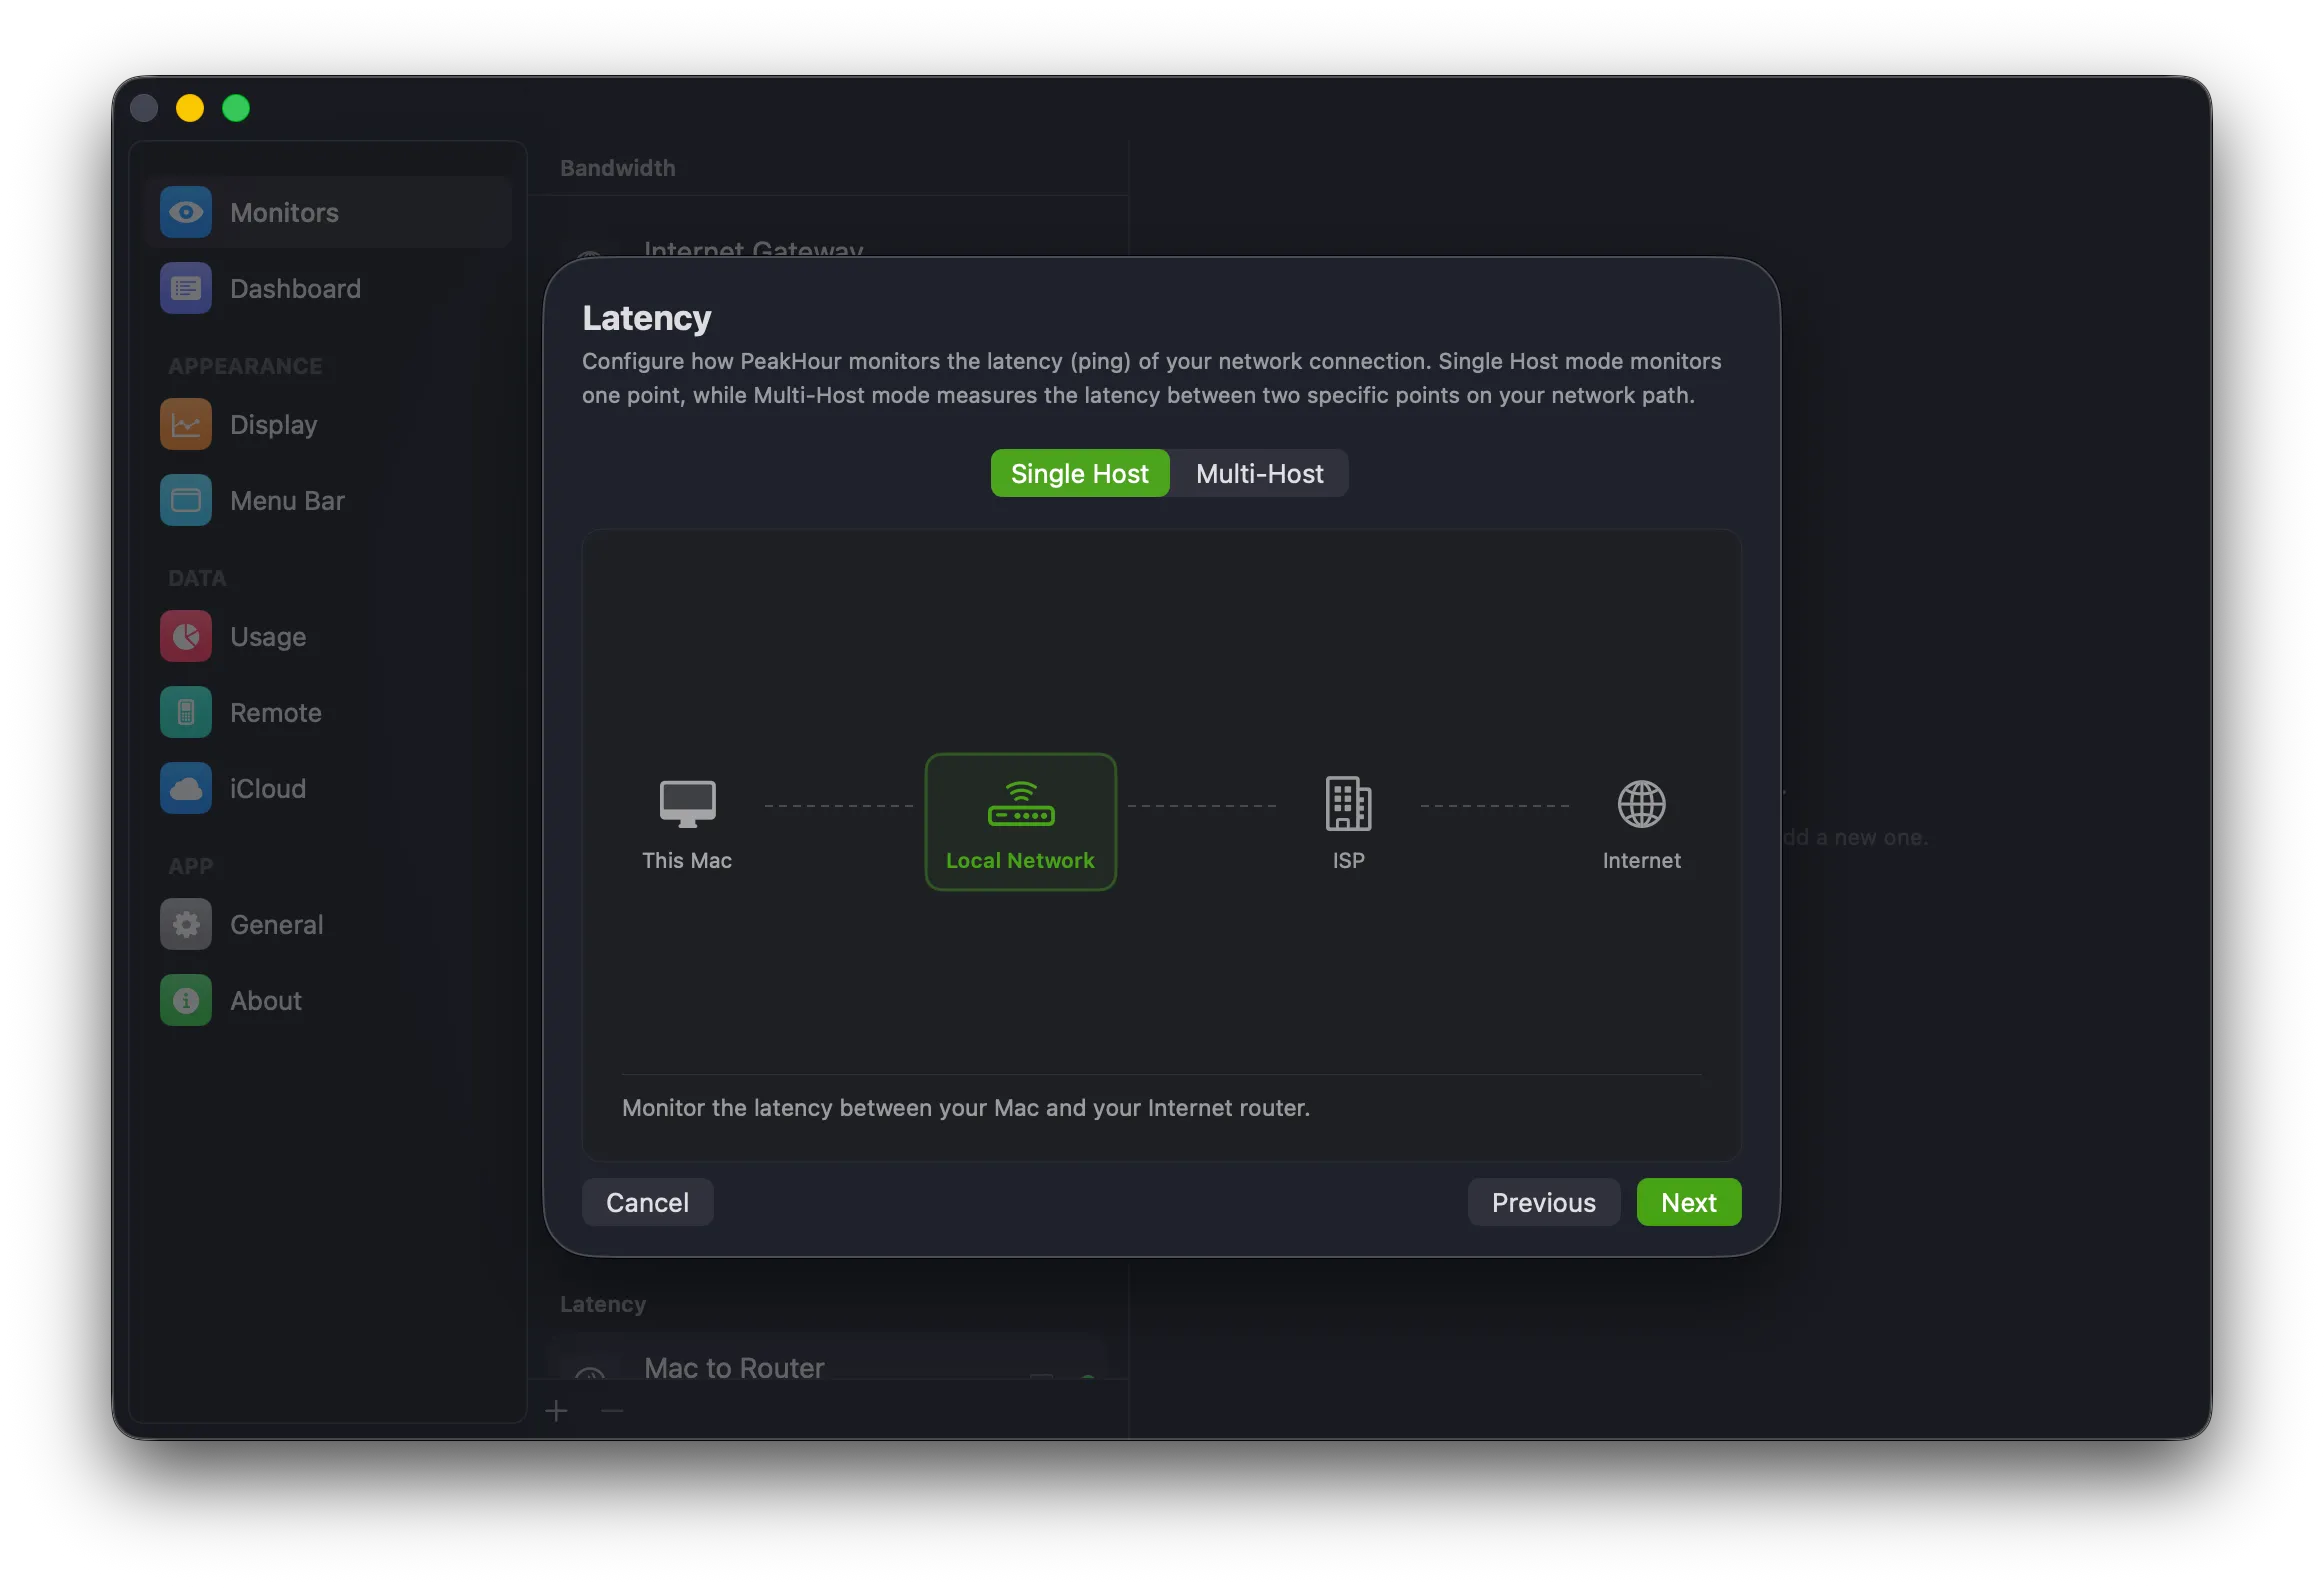
Section titled “2. Choose what to measure”The Latency screen lets you pick what to measure using the Single Host / Multi-Host toggle at the top:
- Single Host — measures the latency from your Mac to one point on the path.
- Multi-Host — measures the latency between two points, isolating a specific segment of the path.
Single Host
Section titled “Single Host”In Single Host mode, pick the endpoint to measure the latency to. The path runs This Mac → Local Network → ISP → Internet; select the point you want.
Local Network
Section titled “Local Network”Measures the latency from your Mac to your local internet gateway (router) — typically the first hop. PeakHour discovers the router automatically using traceroute.
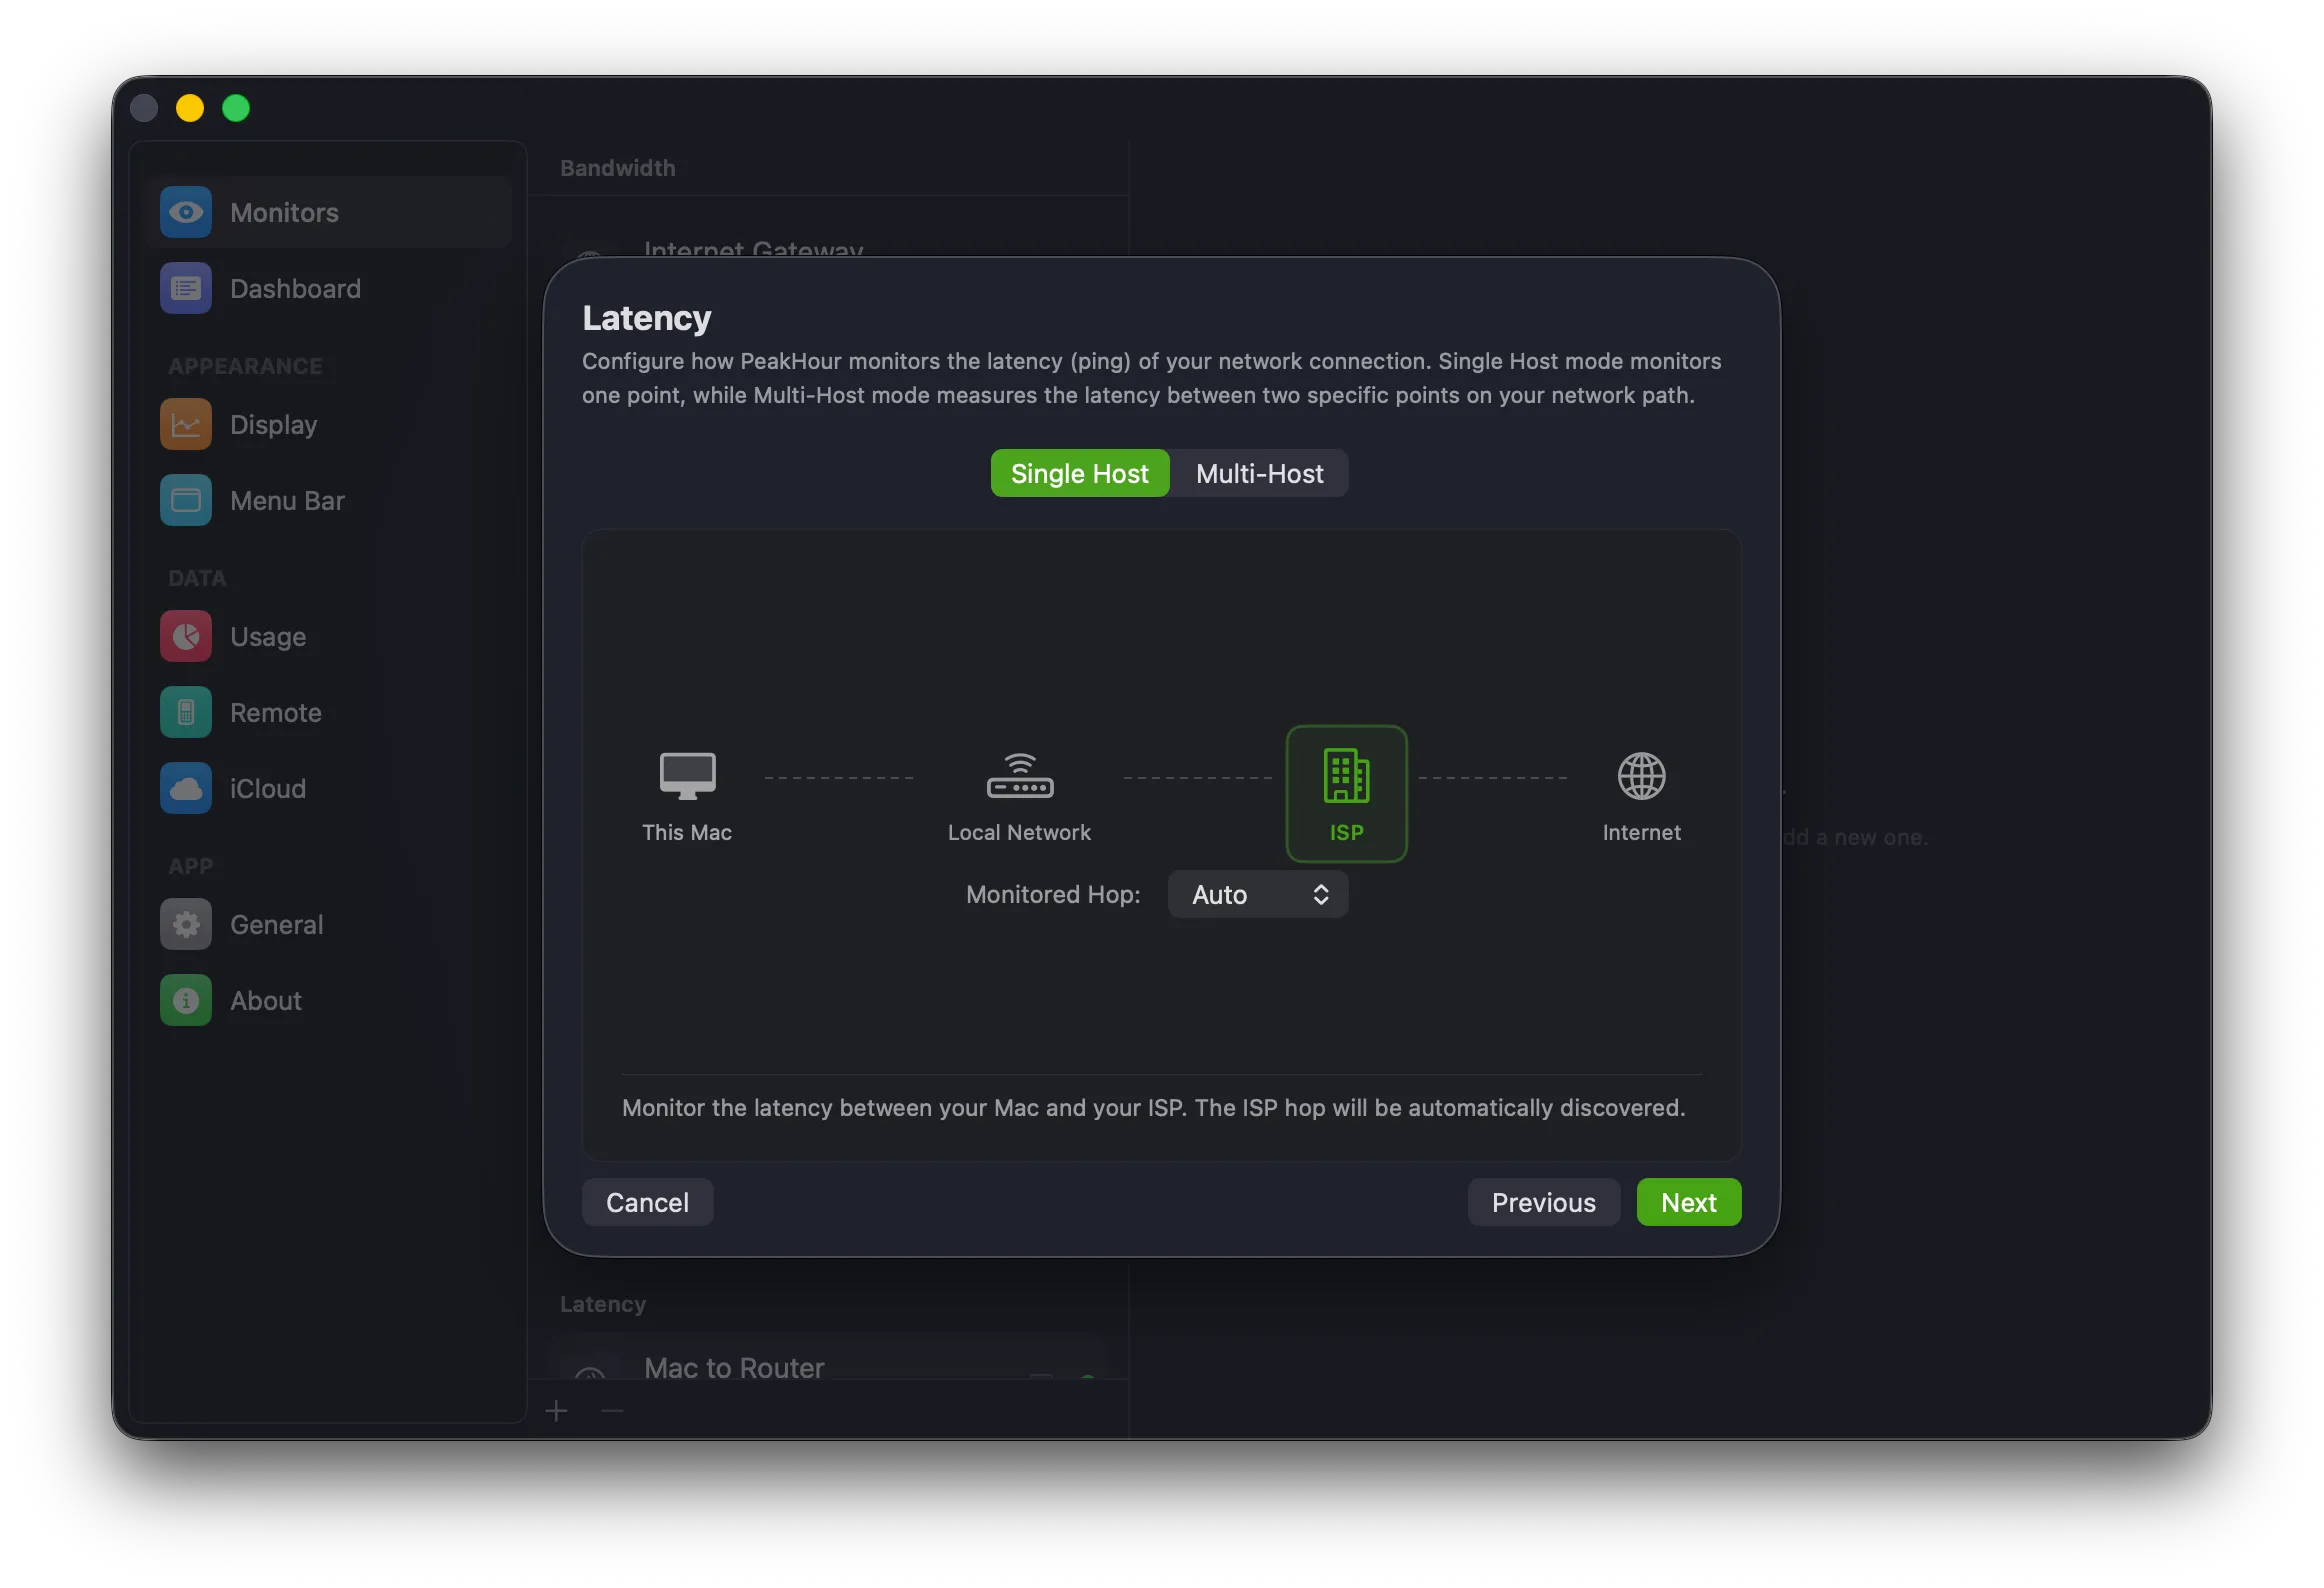
Measures the latency from your Mac to your ISP — typically the second hop. The Monitored Hop dropdown defaults to Auto, which discovers the right hop for you; set a specific hop only if the auto-discovered one doesn’t respond to ping.
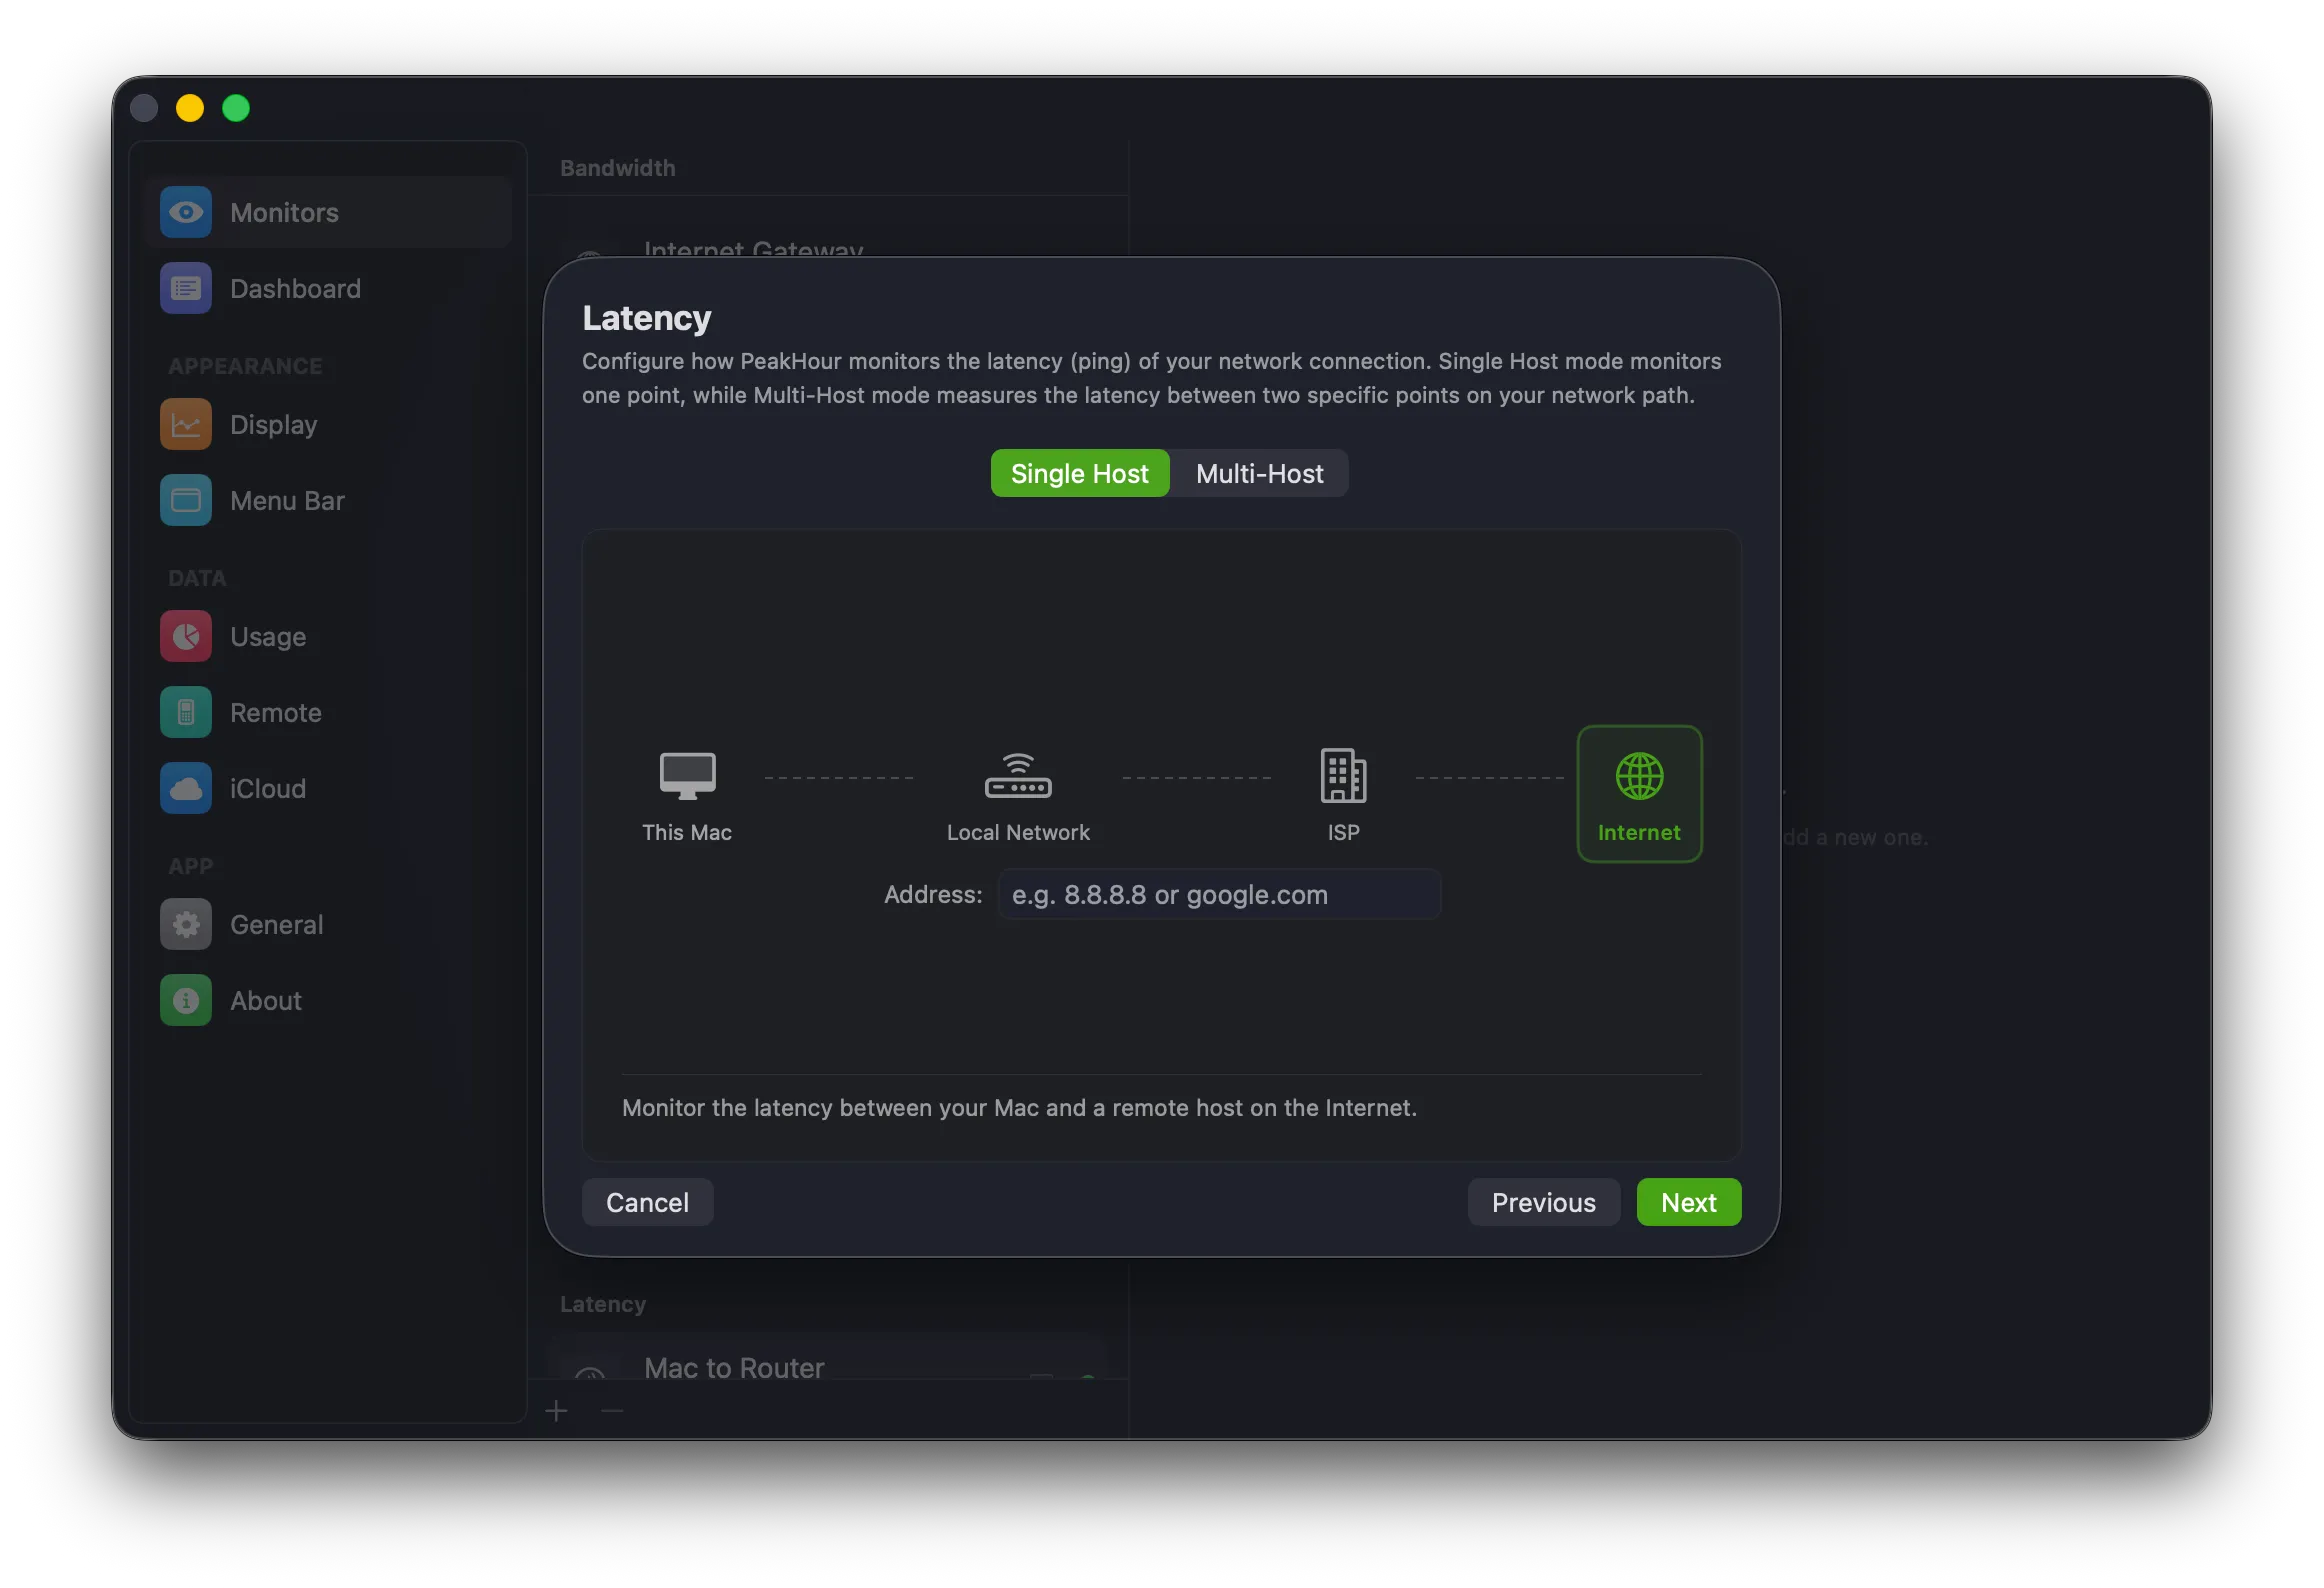
Internet
Section titled “Internet”Measures the latency from your Mac to any host you choose. Enter a hostname or IP address (for example, 8.8.8.8 or google.com) in the Address field.
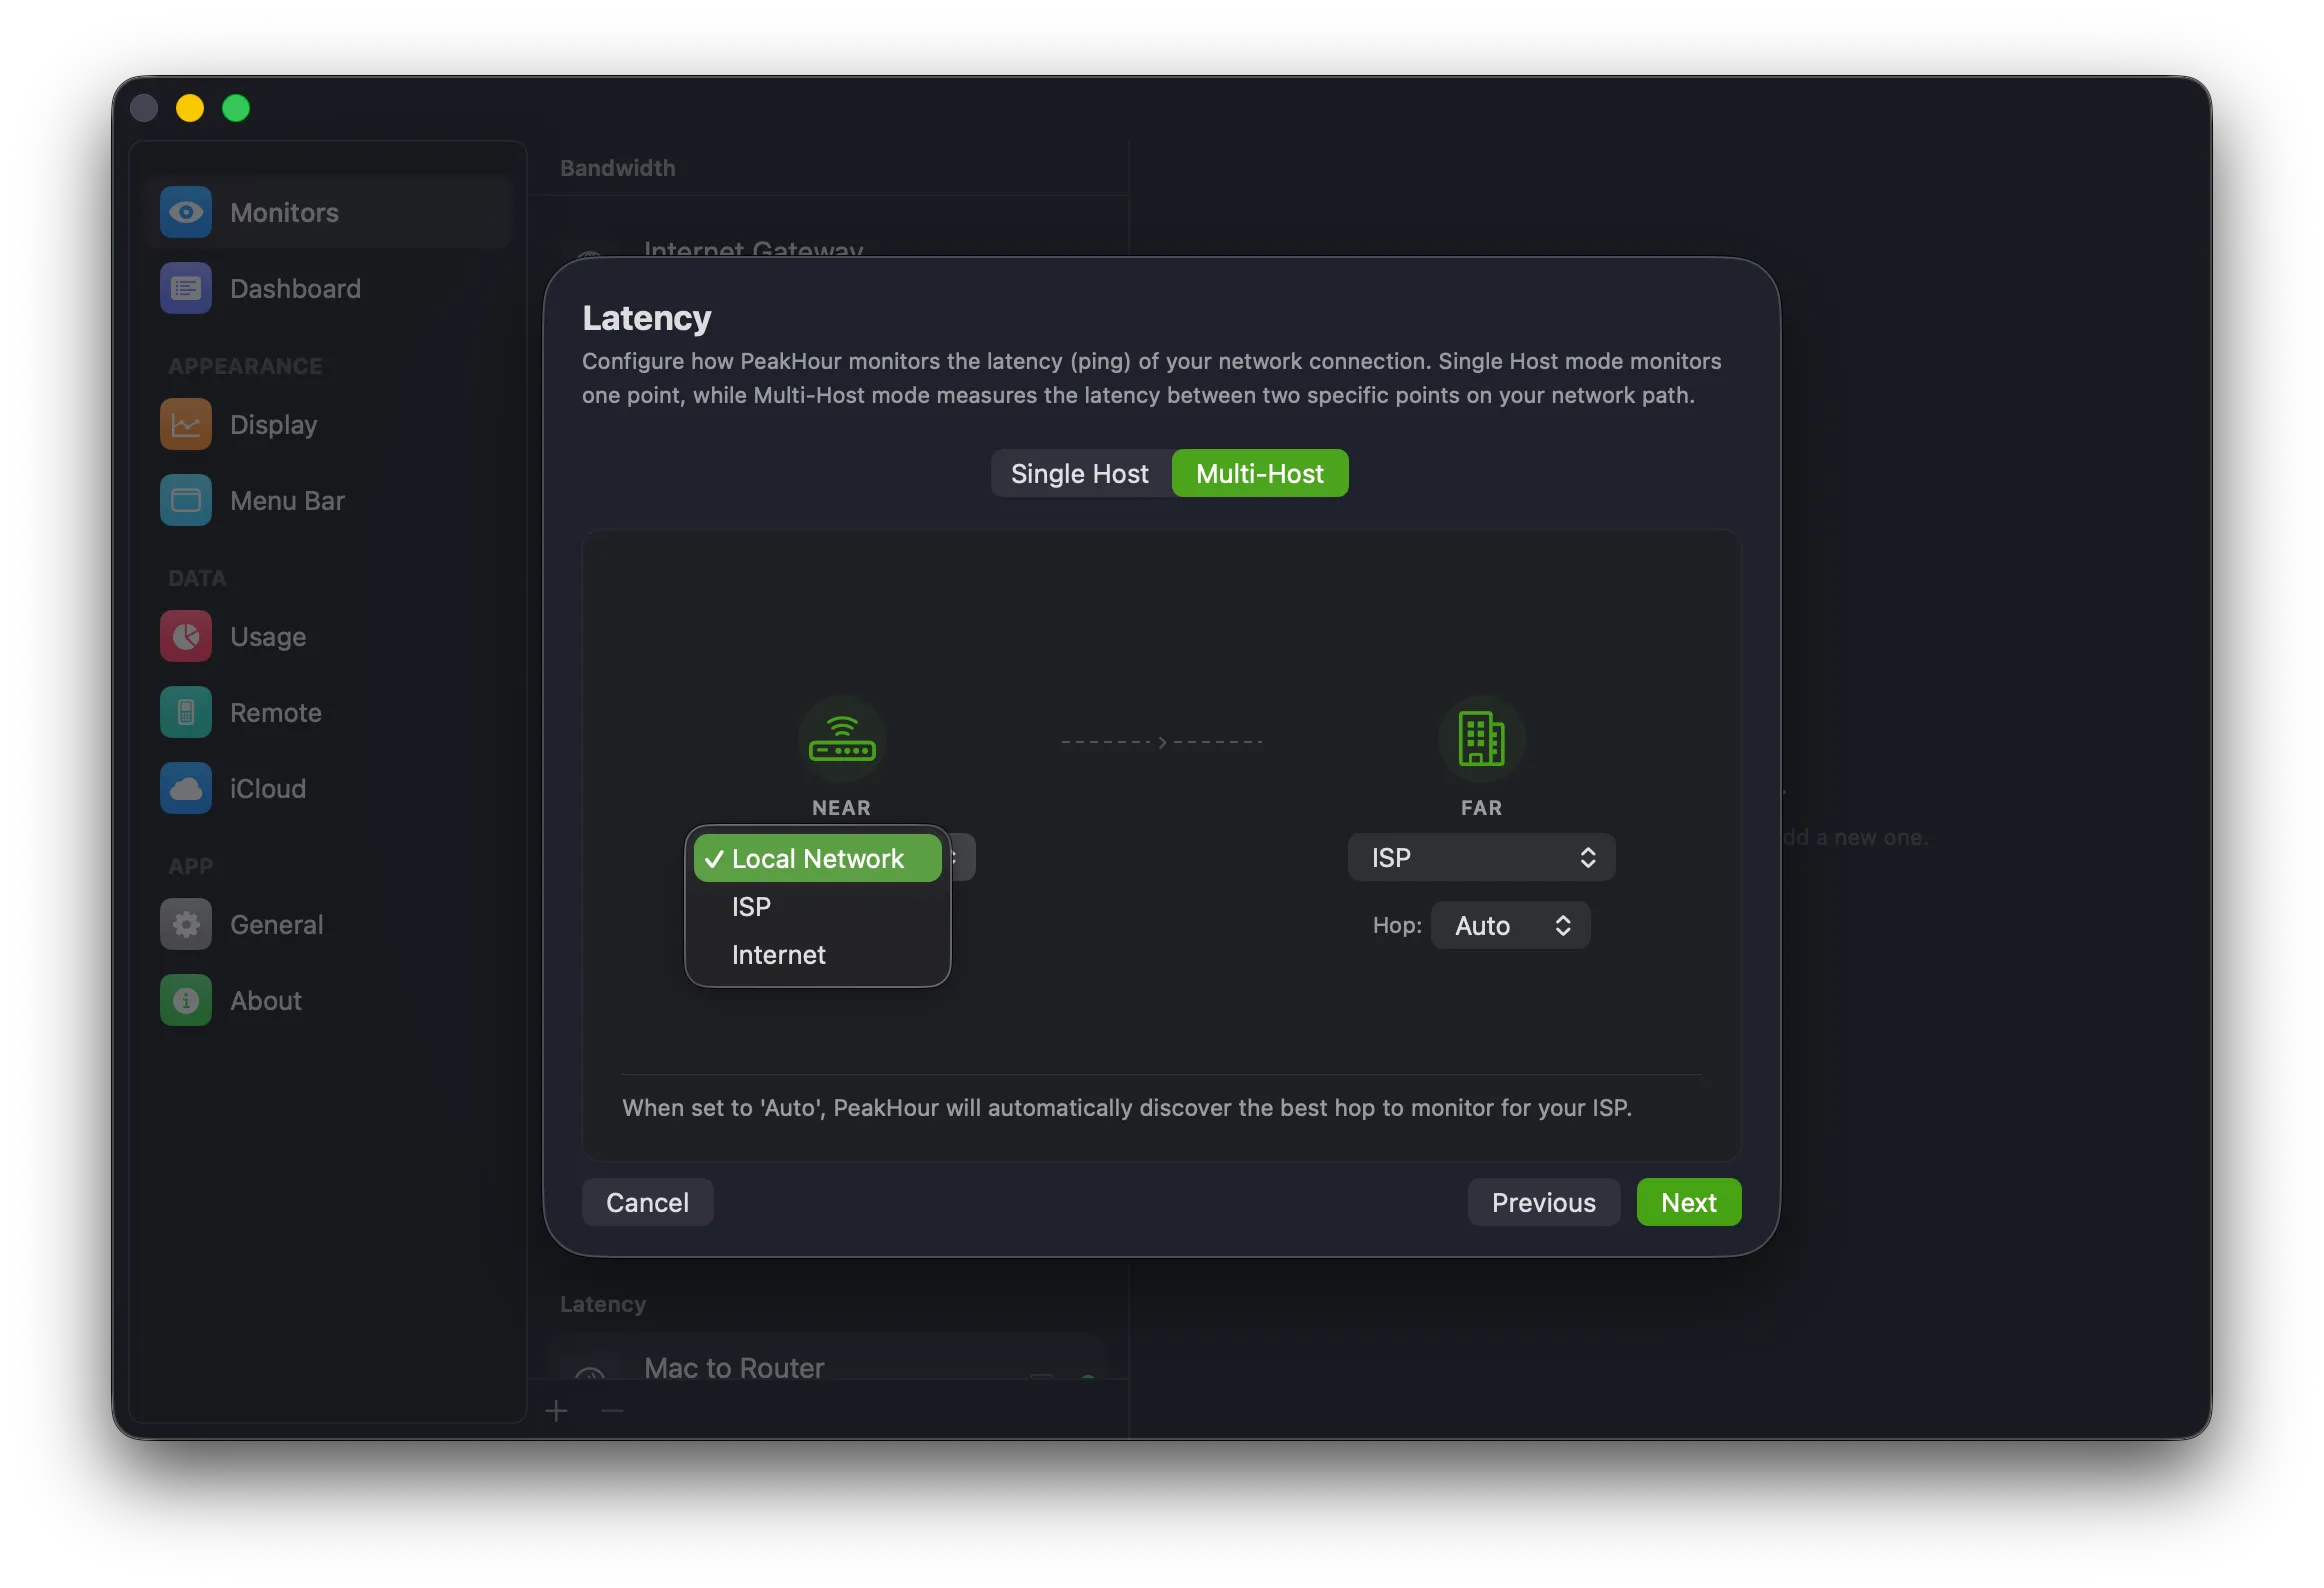
Multi-Host
Section titled “Multi-Host”Multi-Host mode measures the latency between two points on the path — a Near endpoint and a Far endpoint — so you can isolate where high or inconsistent latency is coming from. This is how the Internet Dashboard measures hops like Router → ISP.
Choose the Near and Far endpoints from their dropdowns. Each can be Local Network, ISP, or Internet.
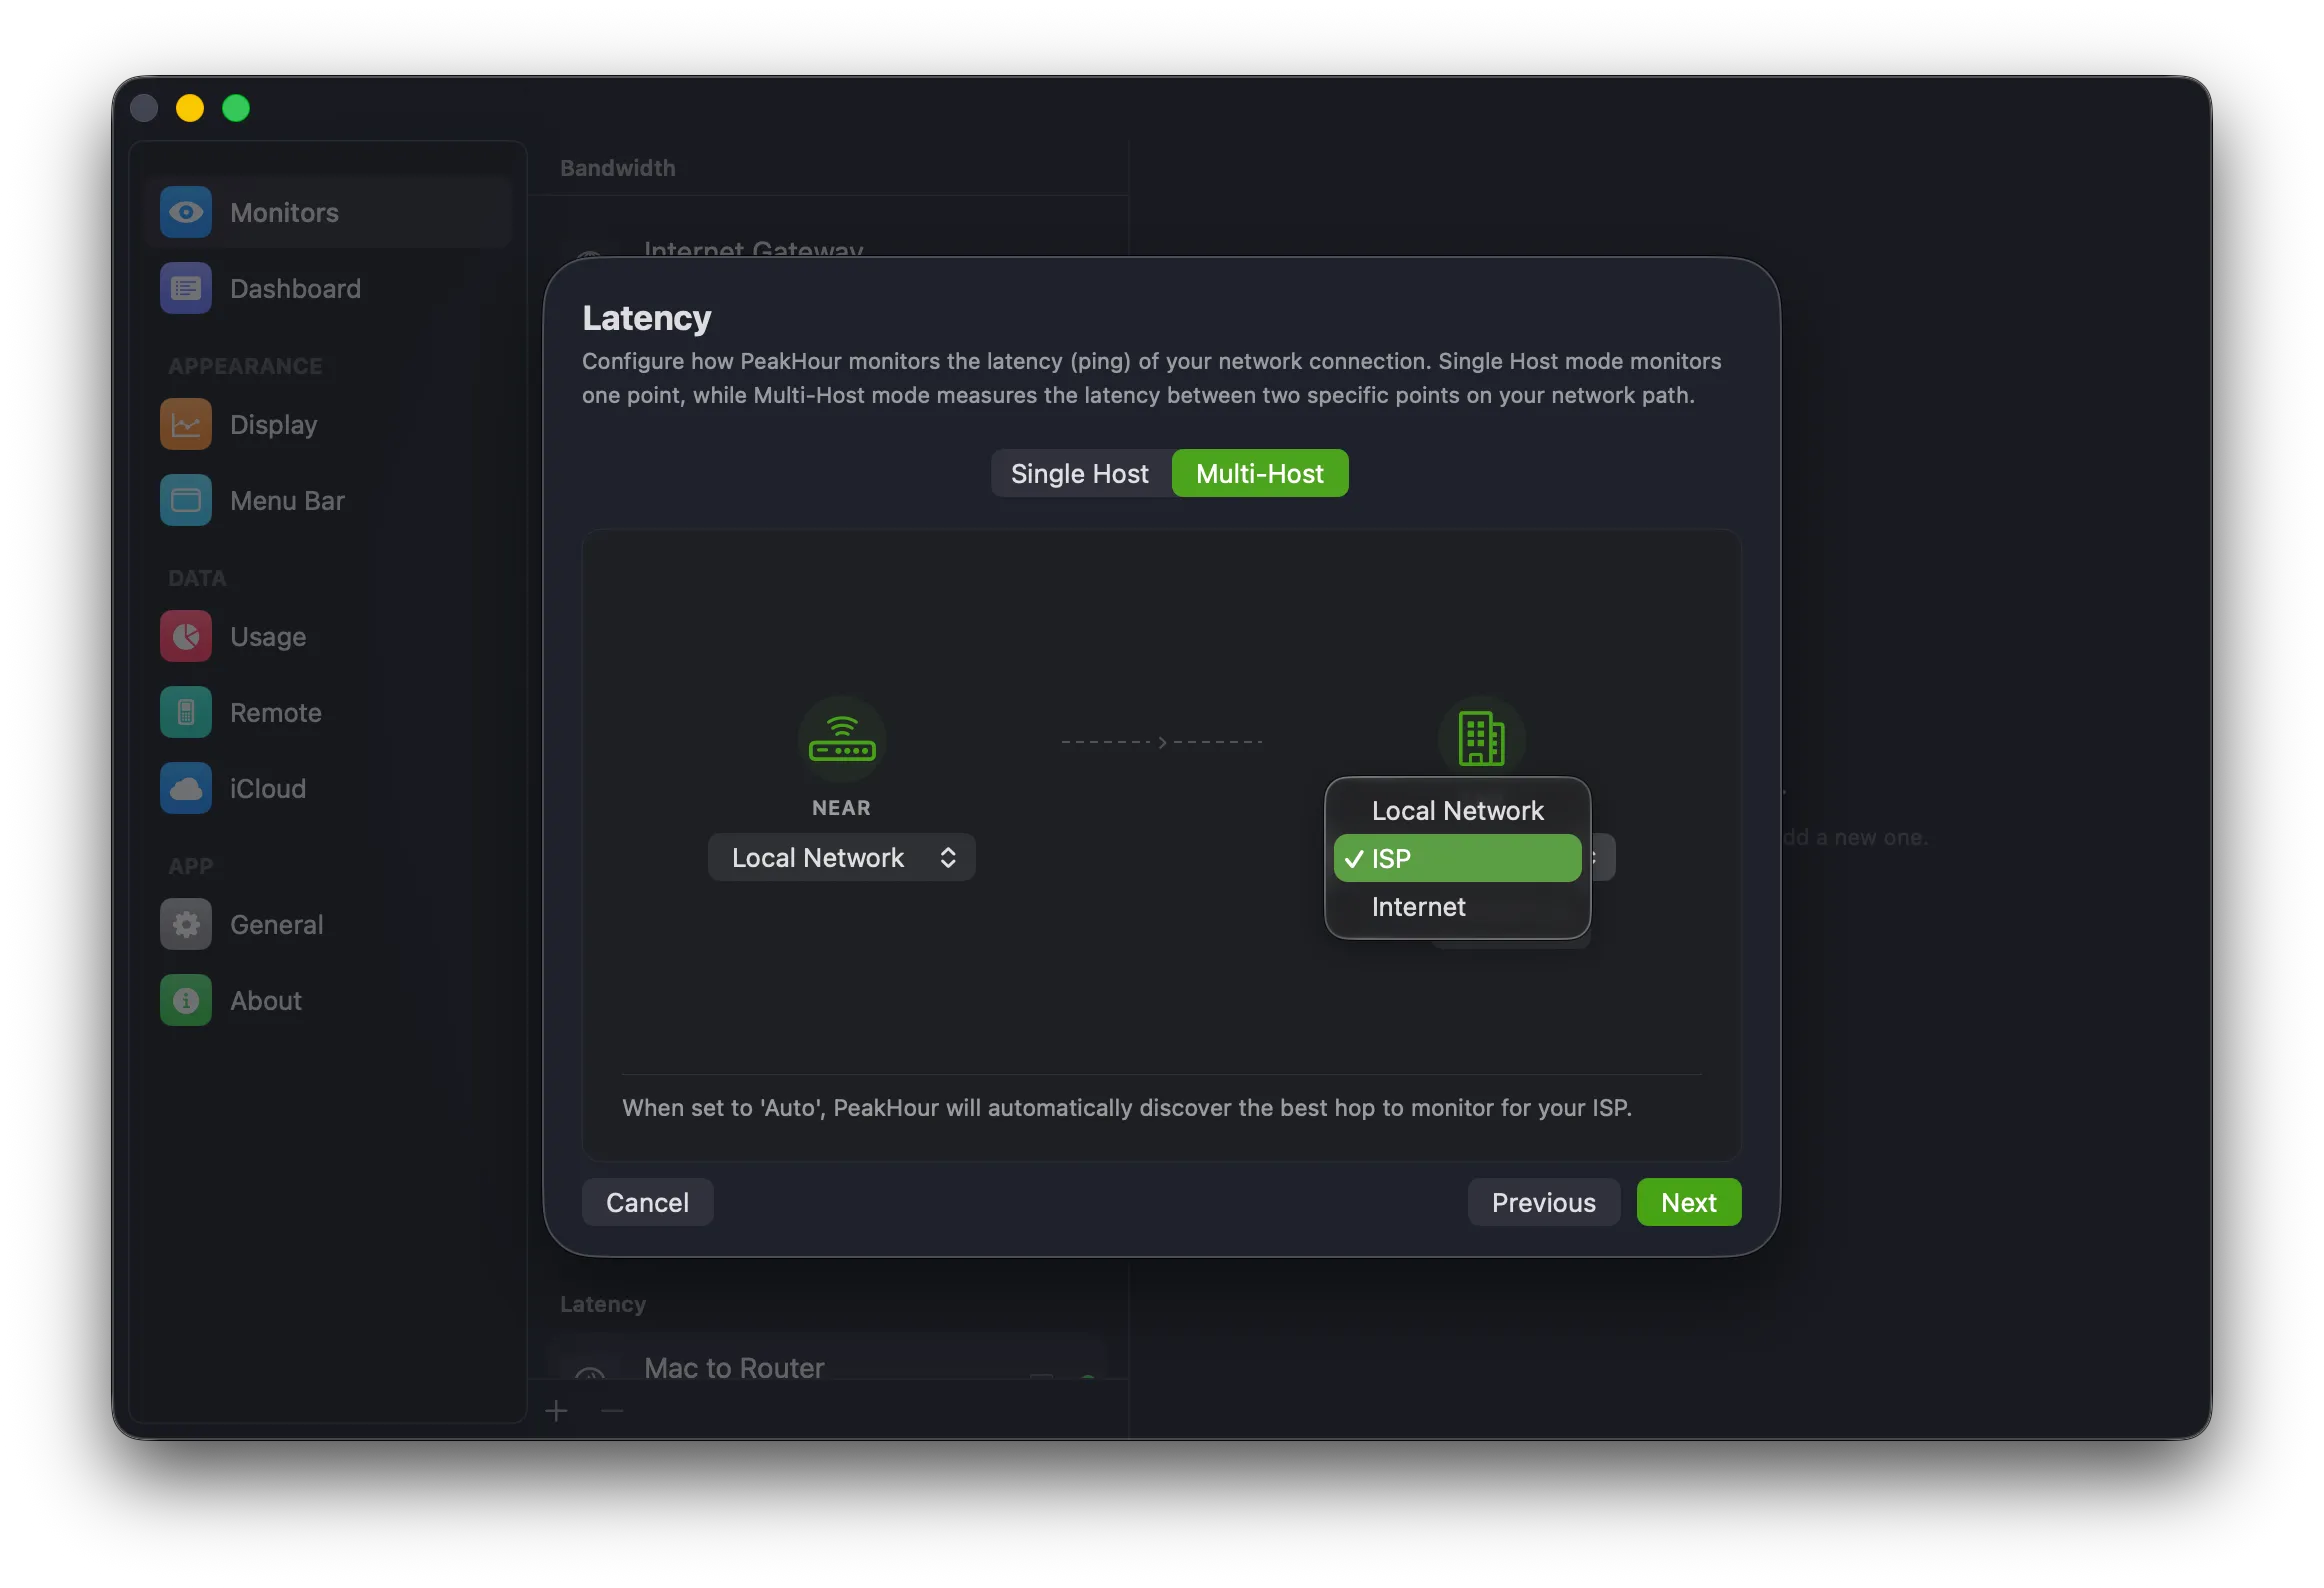
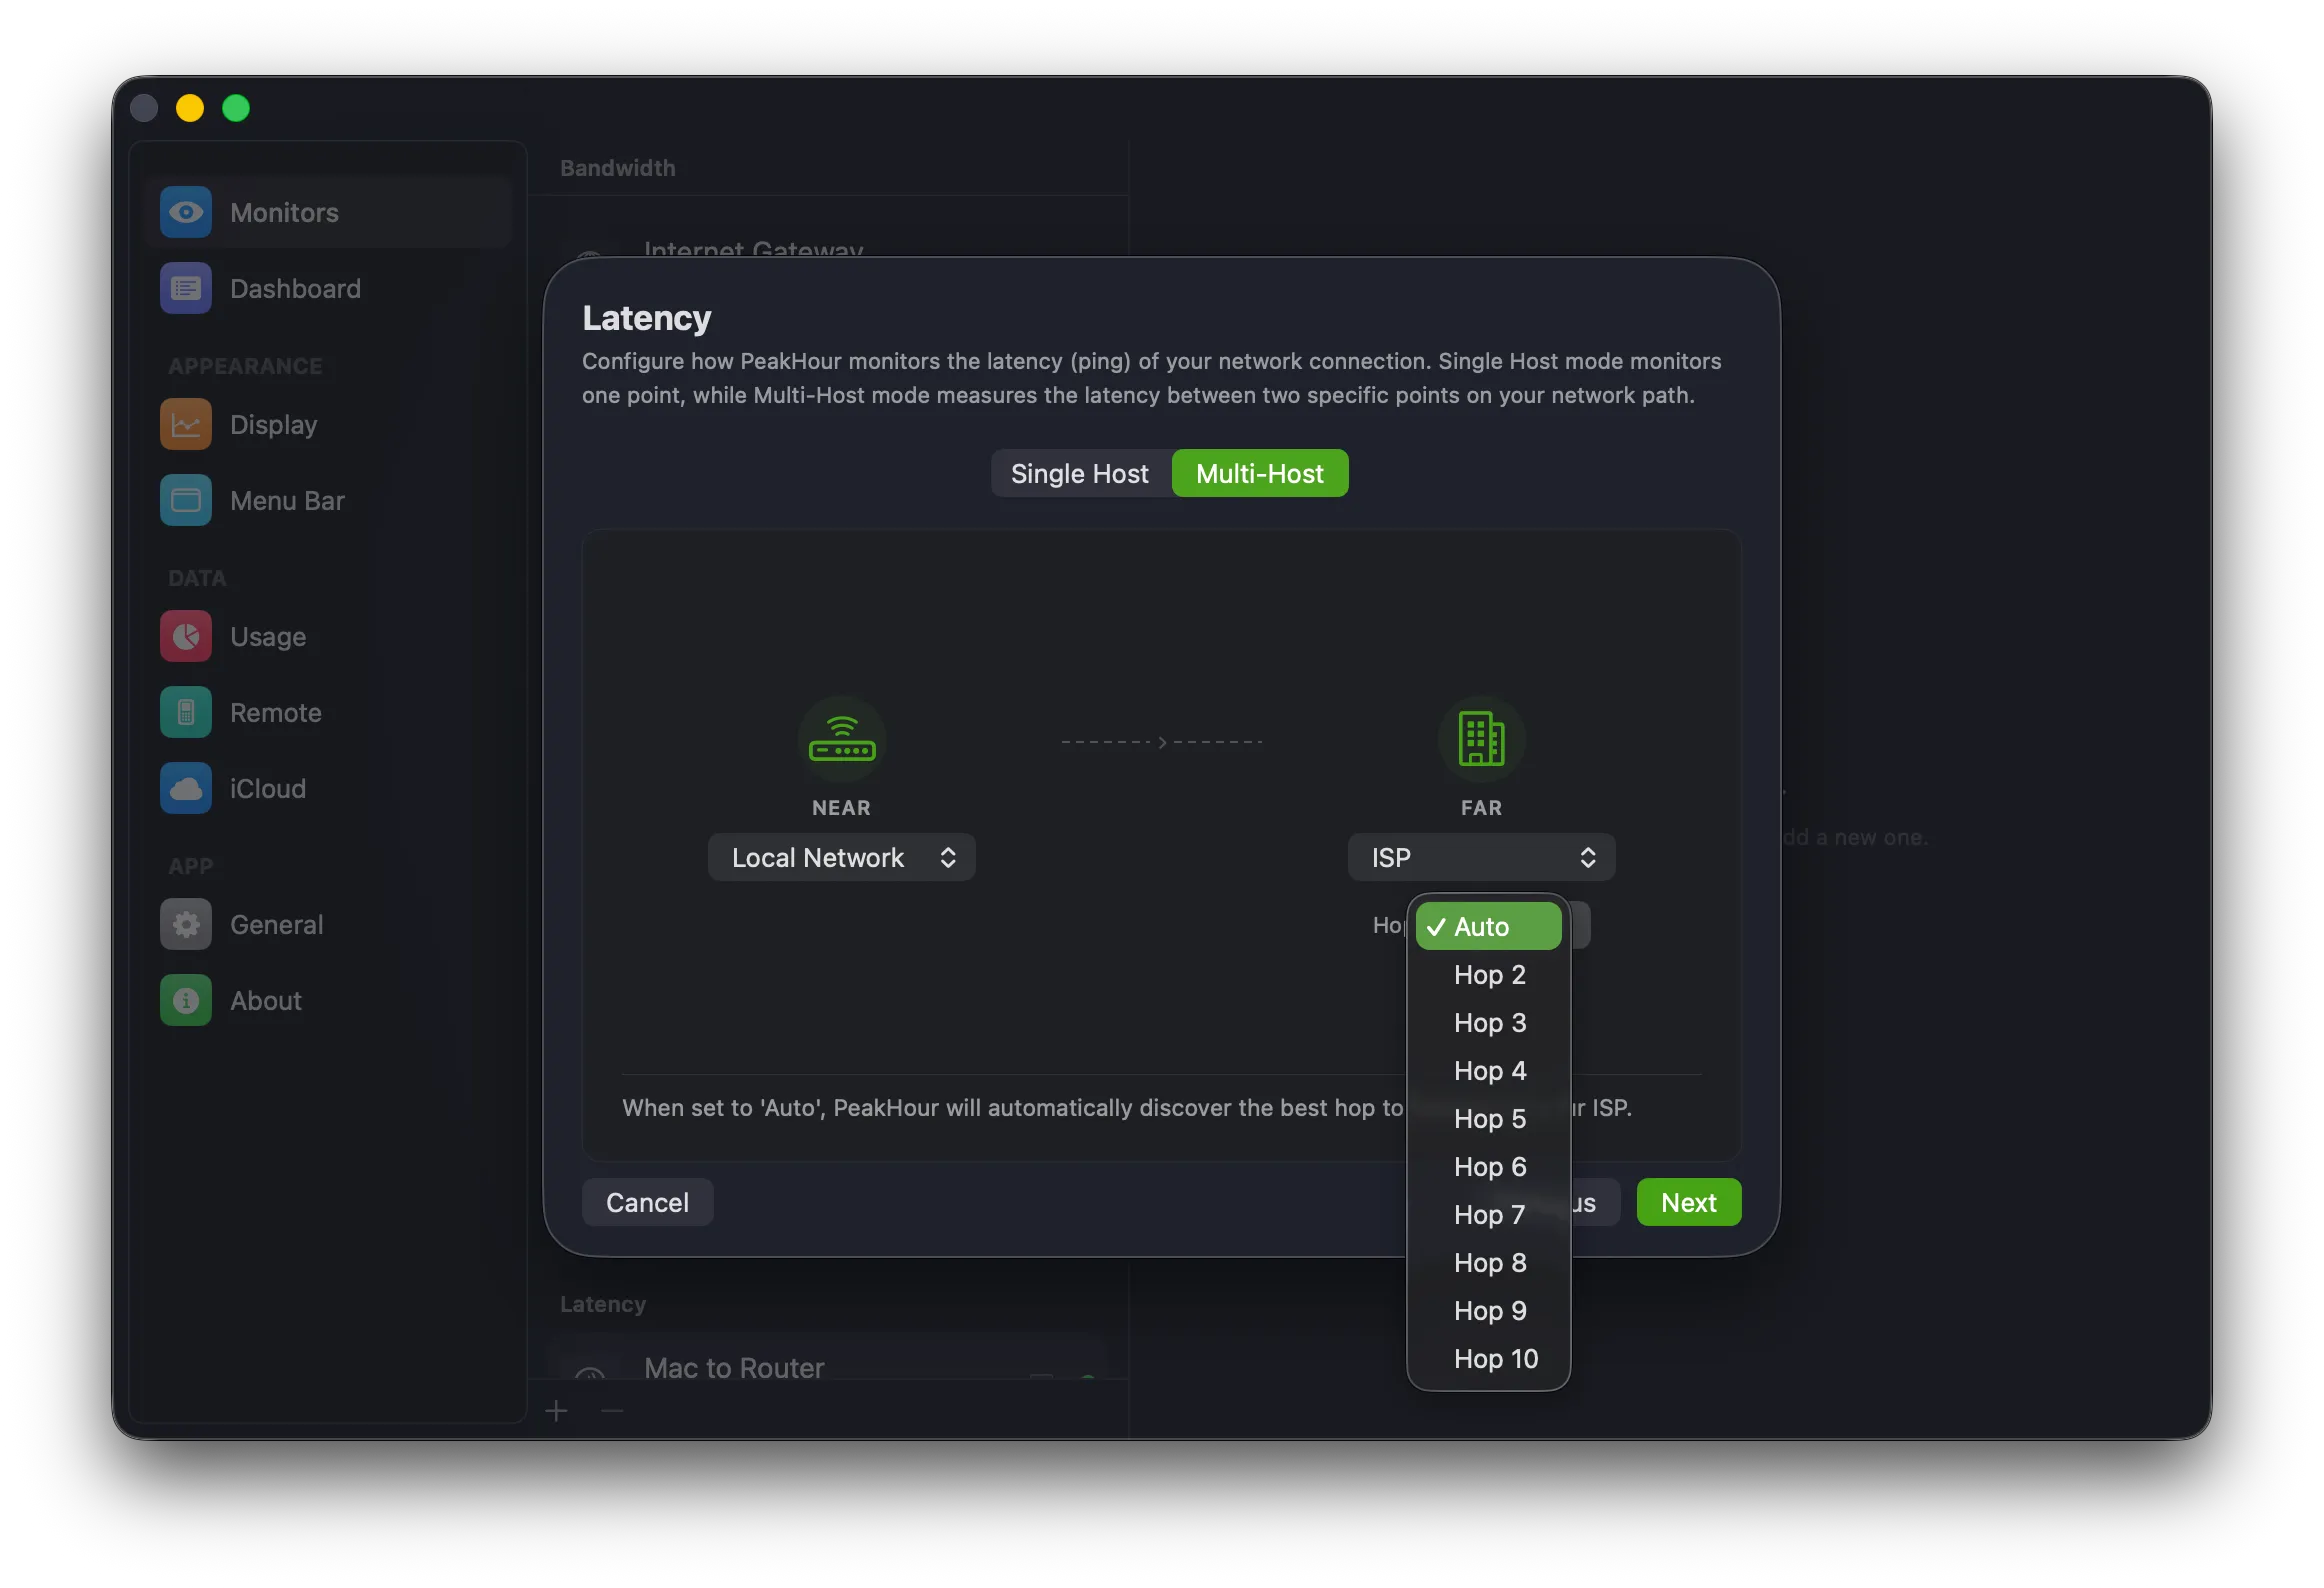
When an endpoint is set to ISP, a Hop dropdown appears. Leave it on Auto to let PeakHour discover the best hop for your ISP, or pick a specific hop (Hop 2–Hop 10) if needed.
When you’ve chosen what to measure, click Next.
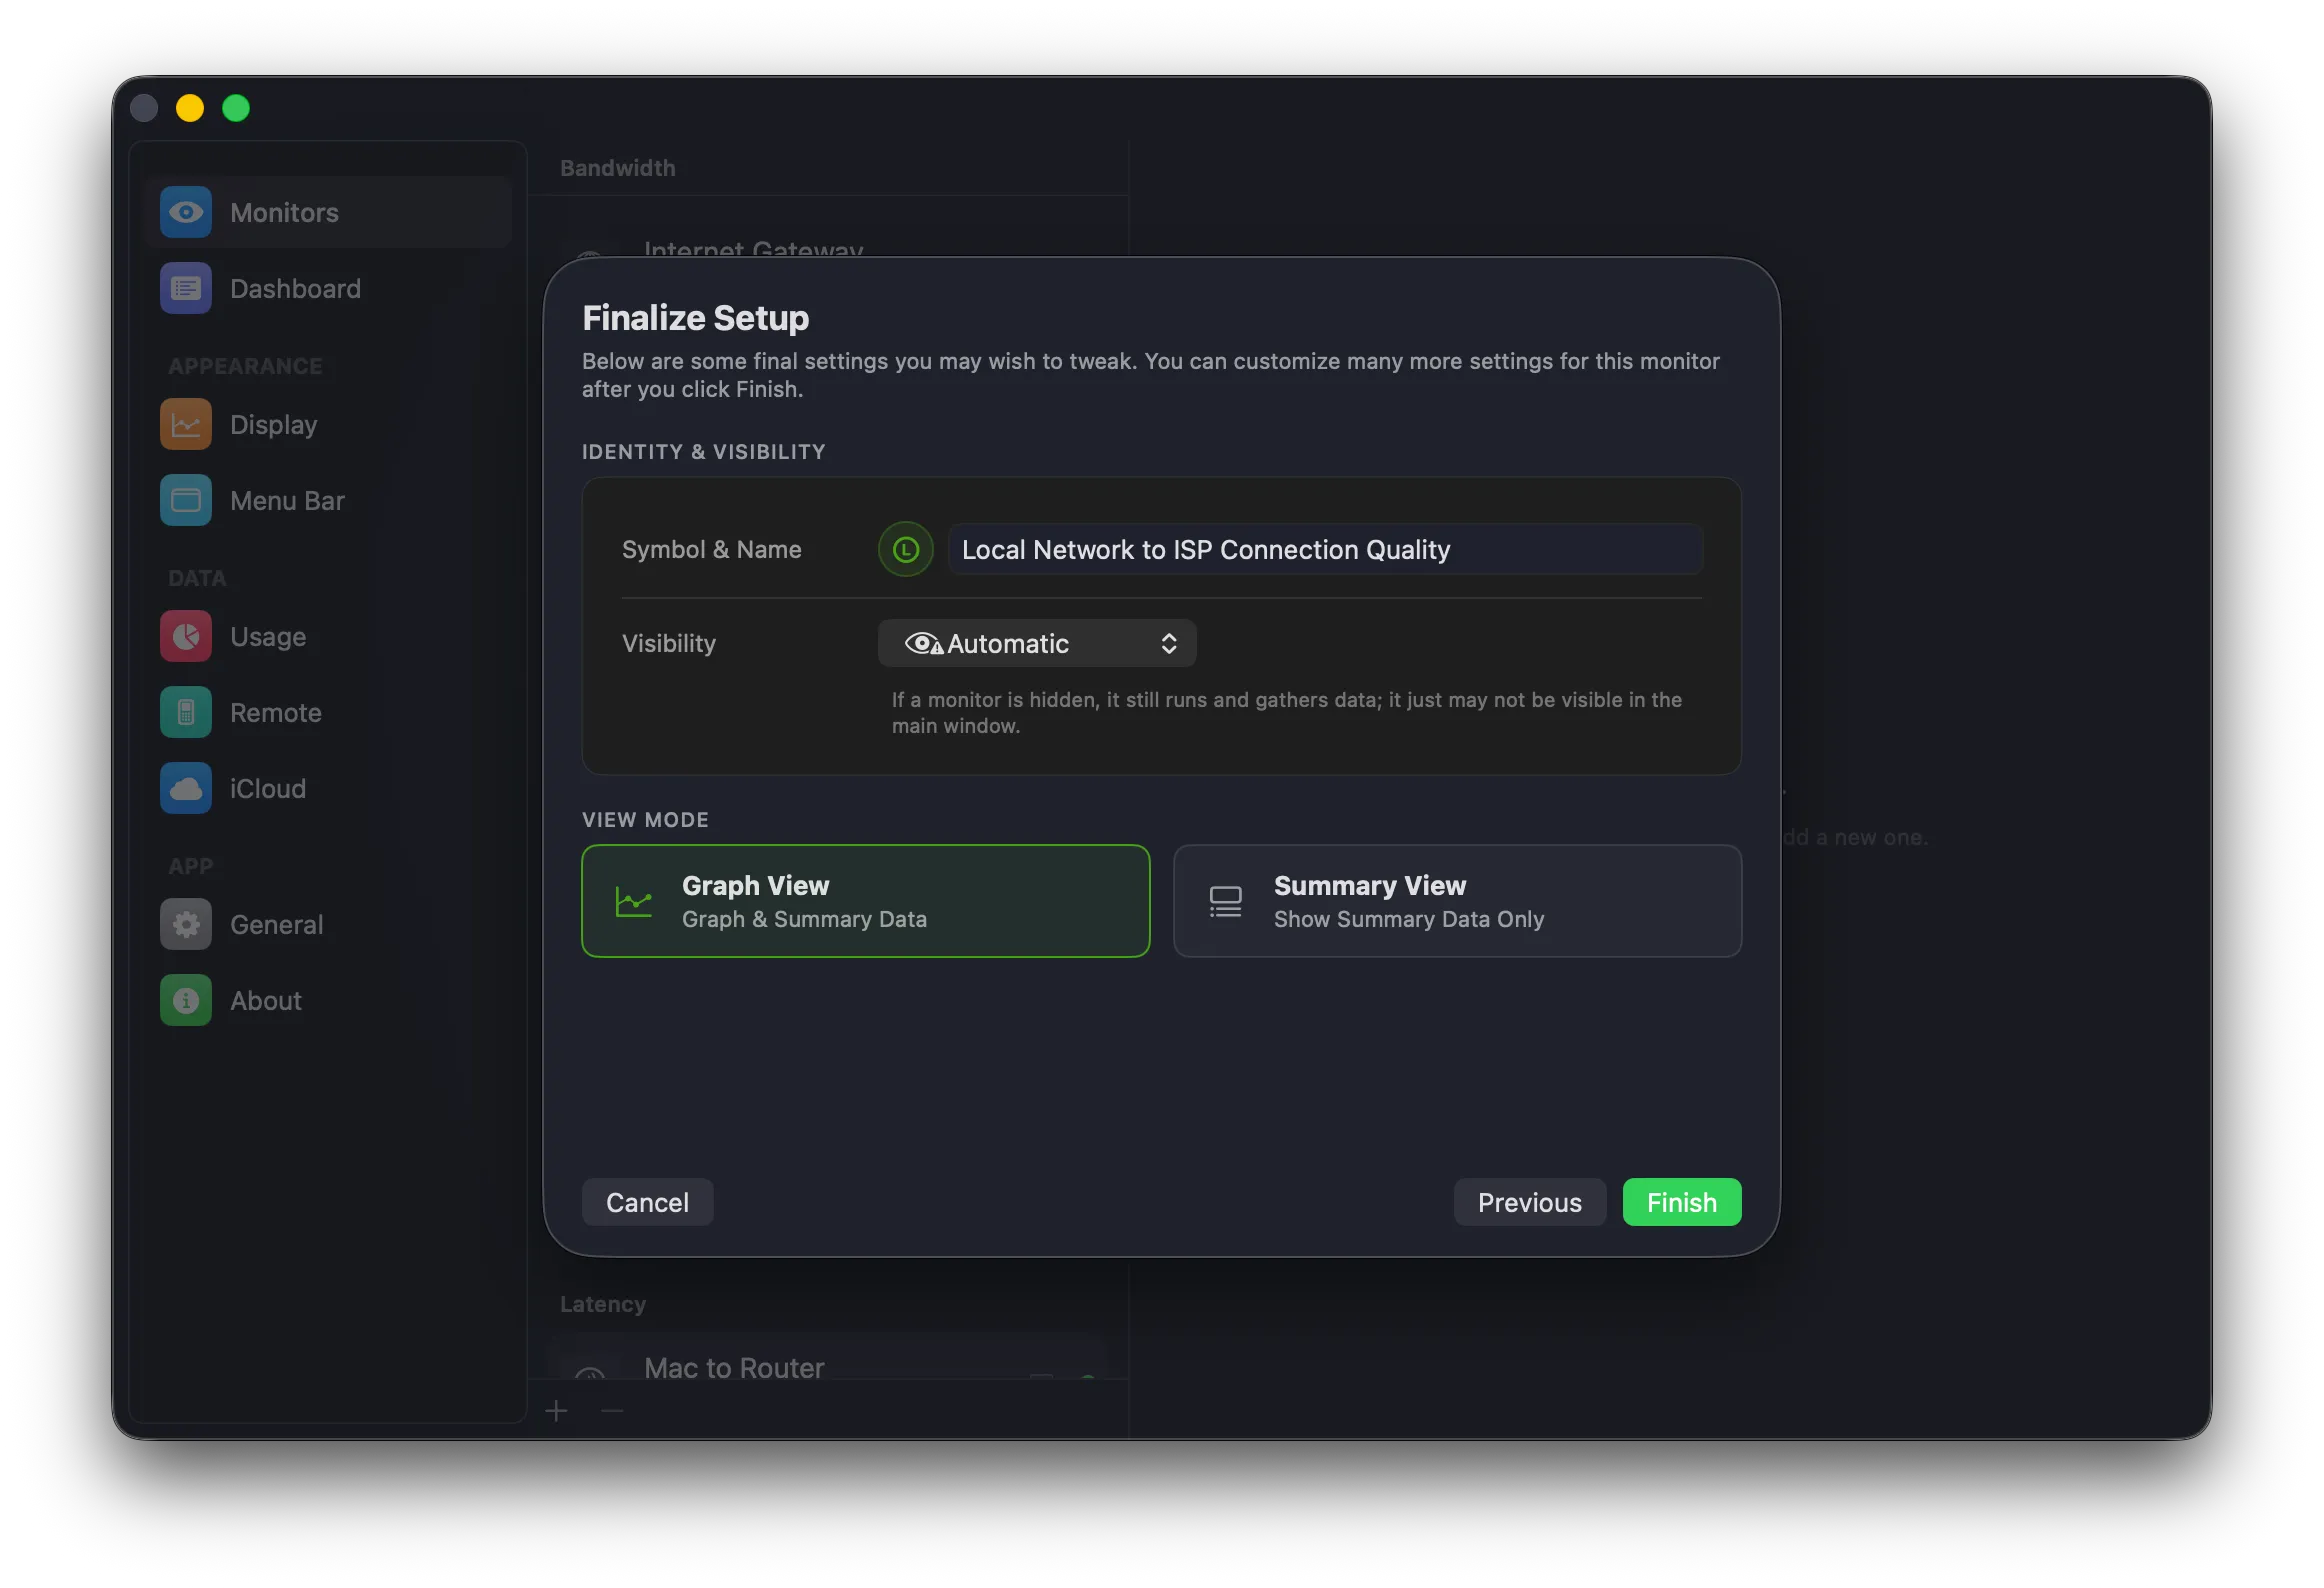
3. Finalize setup
Section titled “3. Finalize setup”The last screen sets a few key parameters. PeakHour suggests a name based on the endpoints you chose. You can adjust all of these (and many more) later in Settings → Latency Monitor.
| Setting | Description |
|---|---|
| Symbol & Name | The icon and name for the monitor. Click either to change it. |
| Visibility | Whether the monitor appears in the main window. Automatic hides it when it can’t be reached; you can also force it to always show or always hide. A hidden monitor still runs and gathers data — it just may not be visible. |
| View Mode | Graph View shows the monitor with its graph; Summary View shows summary data only (collapsed). |
Click Finish. The new monitor appears in the main window and, if configured, the menu bar.
What next?
Section titled “What next?”There are many more ways to customise a Latency Monitor — see the Latency Monitor settings, where you can adjust polling intervals, latency thresholds, packet count, and colors.
Was this page helpful?
Found something wrong, unclear, or out of date? Let us know and we'll fix it.